

Question: Horizontal & Vertical Analysis - ACG 2011 Starbucks (SBUX) and Dunkin' (DNKN) Years 2016 & 2017 1. Ratios Liquidity ratios Profitability ratios Solvency ratios 2.
Horizontal & Vertical Analysis - ACG 2011 Starbucks (SBUX) and Dunkin' (DNKN) Years 2016 & 2017
1. Ratios Liquidity ratios Profitability ratios Solvency ratios
2. Perform a horizontal and vertical analysis for the companies on the Balance Sheet and the Income Statement.
3. Write your analysis and interpretations of the ratios & analyses.
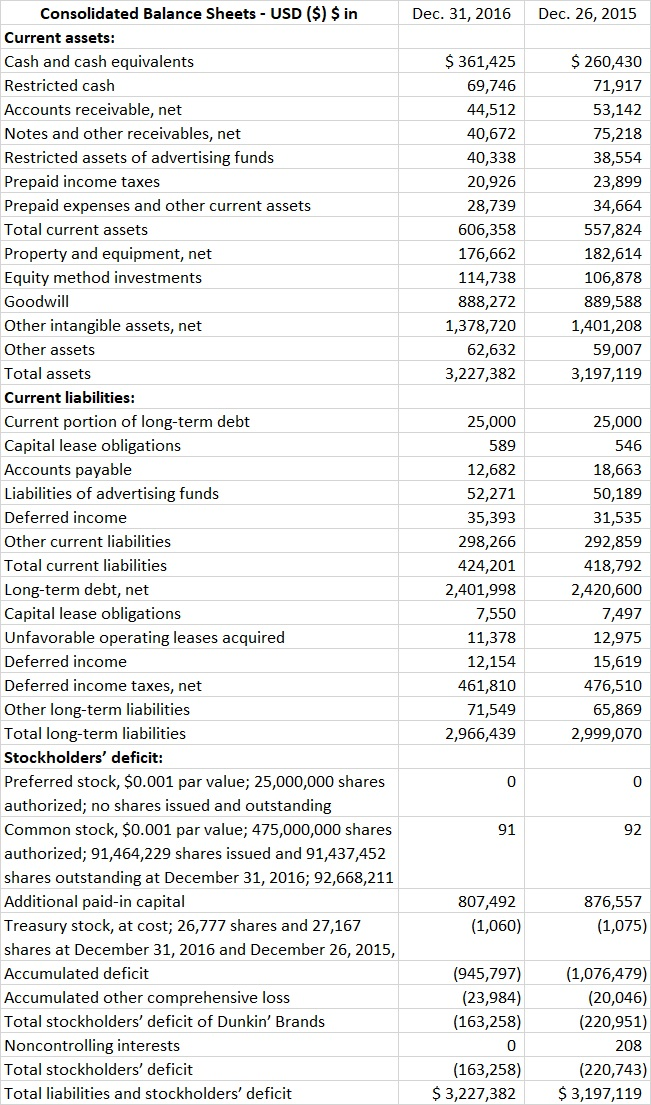
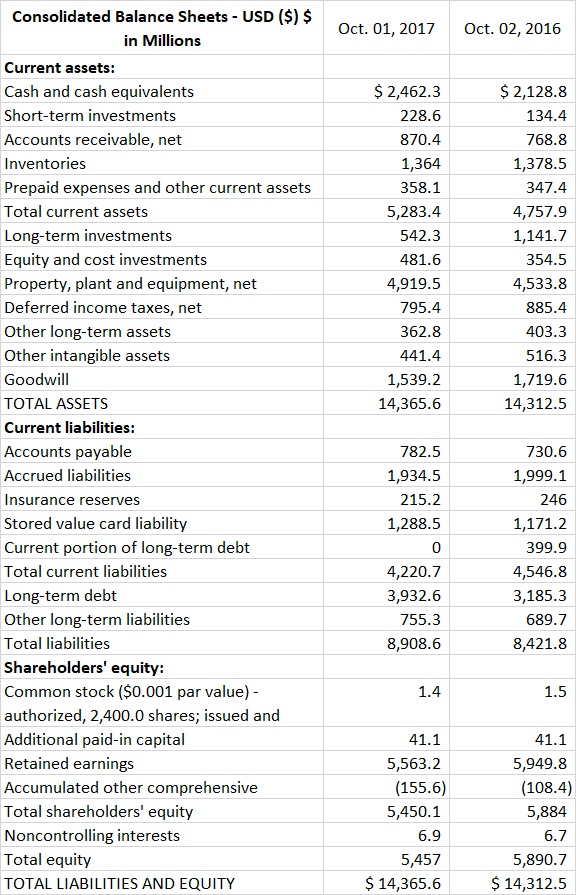
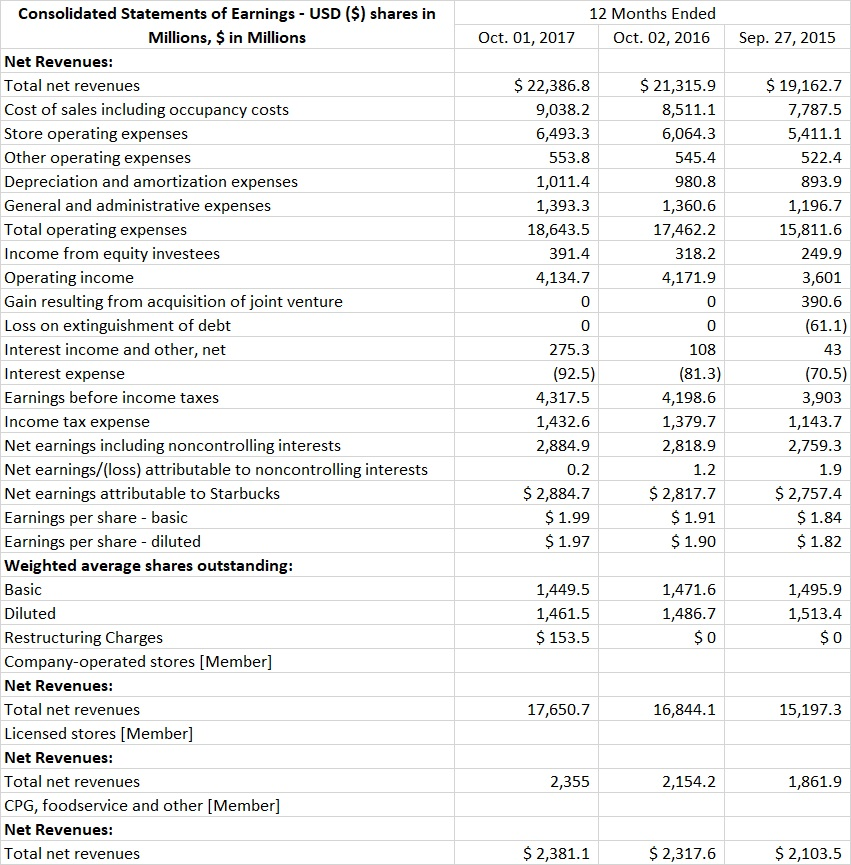
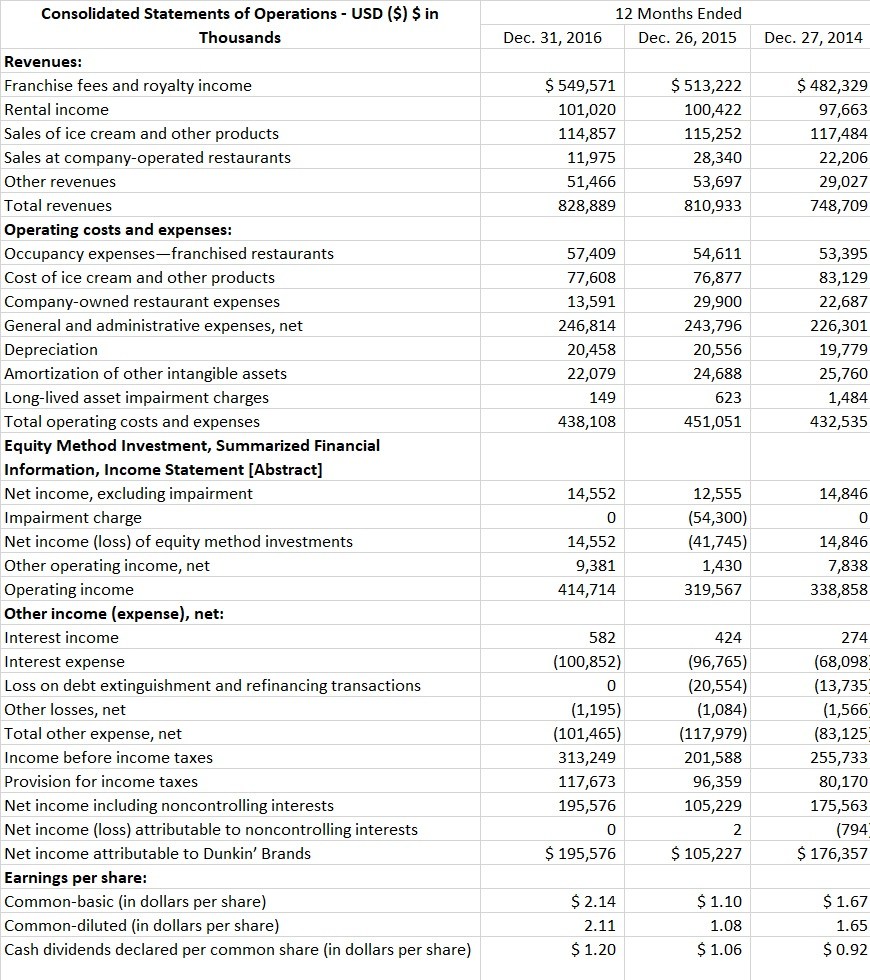
Consolidated Balance Sheets USD ($) $in Dec. 31, 2016 Dec. 26, 2015 Current assets: $ 361,425 $ 260,430 Cash and cash equivalents 71,917 Restricted cash 69,746 Accounts receivable, net 53,142 44,512 Notes and other receivables, net 40,672 75,218 Restricted assets of advertising funds 40,338 38,554 Prepaid income taxes 20,926 23,899 28,739 Prepaid expenses and other current assets 34,664 Total current assets 606,358 557,824 176,662 Property and equipment, net 182,614 Equity method investments 114,738 106,878 Goodwill 888,272 889,588 Other intangible assets, net 1,378,720 1,401,208 Other assets 59,007 62,632 Total assets 3,227,382 3,197,119 Current liabilities: Current portion of long-term debt 25,000 25,000 Capital lease obligations Accounts payable 589 546 18,663 12,682 Liabilities of advertising funds 52,271 50,189 Deferred income 35,393 31,535 Other current liabilities 298,266 292,859 Total current liabilities 424,201 418,792 Long-term debt, net Capital lease obligations Unfavorable operating leases acquired 2,401,998 2,420,600 7,550 7,497 11,378 12,975 Deferred income 12,154 15,619 Deferred income taxes, net 461,810 476,510 Other long-term liabilities 71,549 65,869 2,999,070 Total long-term liabilities 2,966,439 Stockholders' deficit: Preferred stock, $0.001 par value; 25,000,000 shares 0 authorized; no shares issued and outstanding Common stock, $0.001 par value; 475,000,000 shares 91 92 authorized; 91,464,229 shares issued and 91,437,452 shares outstanding at December 31, 2016; 92,668,211 Additional paid-in capital 807,492 876,557 Treasury stock, at cost; 26,777 shares and 27,167 (1,060) (1,075) shares at December 31, 2016 and December 26, 2015, (1,076,479) Accumulated deficit (945,797) Accumulated other comprehensive loss (23,984) (20,046) Total stockholders' deficit of Dunkin' Brands (163,258) (220,951) Noncontrolling interests 0 208 Total stockholders' deficit (163,258) (220,743) $3,227,382 $3,197,119 Total liabilities and stockholders' deficit Consolidated Balance Sheets USD ($) $ Oct. 01, 2017 Oct. 02, 2016 in Millions Current assets: $2,462.3 $2,128.8 Cash and cash equivalents Short-term investments 134.4 228.6 Accounts receivable, net 870.4 768.8 Inventories 1,364 1,378.5 Prepaid expenses and other current assets 347.4 358.1 Total current assets 5,283.4 4,757.9 542.3 Long-term investments 1,141.7 Equity and cost investments 481.6 354.5 Property, plant and equipment, net 4,919.5 4,533.8 Deferred income taxes, net 795.4 885.4 Other long-term assets 403.3 362.8 Other intangible assets 441.4 516.3 Goodwill 1,539.2 1,719.6 TOTAL ASSETS 14,365.6 14,312.5 Current liabilities: Accounts payable 782.5 730.6 Accrued liabilities 1,934.5 1,999.1 215.2 Insurance reserves 246 Stored value card liability 1,288.5 1,171.2 Current portion of long-term debt 0 399.9 Total current liabilities 4,220.7 4,546.8 3,185.3 Long-term debt 3,932.6 Other long-term liabilities 755.3 689.7 Total liabilities 8,908.6 8,421.8 Shareholders' equity: Common stock ($0.001 par value) 1.4 1.5 authorized, 2,400.0 shares; issued and Additional paid-in capital Retained earnings 41.1 41.1 5,563.2 5,949.8 Accumulated other comprehensive (155.6) (108.4) Total shareholders' equity 5,450.1 5,884 Noncontrolling interests 6.9 6.7 Total equity 5,457 5,890.7 $14,365.6 $14,312.5 TOTAL LIABILITIES AND EQUITY Consolidated Statements of Earnings USD ($) shares in Millions, $in Millions 12 Months Ended Oct. 01, 2017 Oct. 02, 2016 Sep. 27, 2015 Net Revenues: $ 22,386.8 $ 21,315.9 $19,162.7 Total net revenues Cost of sales including occupancy costs 9,038.2 8,511.1 7,787.5 Store operating expenses Other operating expenses Depreciation and amortization expenses General and administrative expenses 6,064.3 5,411.1 6,493.3 522.4 553.8 545.4 1,011.4 980.8 893.9 1,196.7 1,393.3 1,360.6 Total operating expenses 18,643.5 17,462.2 15,811.6 Income from equity investees 249.9 391.4 318.2 Operating income 3,601 4,134.7 4,171.9 Gain resulting from acquisition of joint venture 0 0 390.6 Loss on extinguishment of debt (61.1) 0 0 Interest income and other, net 275.3 108 43 (92.5) (81.3) (70.5) Interest expense Earnings before income taxes 4,317.5 4,198.6 3,903 Income tax expense 1,432.6 1,379.7 1,143.7 Net earnings including noncontrolling interests Net earnings/(loss) attributable to noncontrolling interests 2,884.9 2,818.9 2,759.3 0.2 1.2 1.9 $2,884.7 $2,817.7 $2,757.4 Net earnings attributable to Starbucks Earnings per share - basic Earnings per share - diluted $1.99 $1.91 $1.84 $1.97 $1.90 $1.82 Weighted average shares outstanding: Basic 1,449.5 1,471.6 1,495.9 Diluted 1,461.5 1,486.7 1,513.4 $ 0 $ 0 $153.5 Restructuring Charges Company-operated stores [Member] Net Revenues Total net revenues 17,650.7 16,844.1 15,197.3 Licensed stores [Member] Net Revenues: Total net revenues 2,355 2,154.2 1,861.9 CPG, foodservice and other [Member] Net Revenues: $2,381.1 $2,317.6 $2,103.5 Total net revenues Consolidated Statements of Operations USD ($) $ in 12 Months Ended Thousands Dec. 31, 2016 Dec. 27, 2014 Dec. 26, 2015 Revenues: Franchise fees and royalty income $549,571 $513,222 $ 482,329 Rental income 101,020 100,422 97,663 Sales of ice cream and other products 114,857 115,252 117,484 Sales at company-operated restaurants 11,975 28,340 22,206 Other revenues 53,697 51,466 29,027 Total revenues 810,933 828,889 748,709 Operating costs and expenses: Occupancy expenses-franchised restaurants Cost of ice cream and other products 54,611 57,409 53,395 77,608 76,877 83,129 Company-owned restaurant expenses 29,900 13,591 22,687 General and administrative expenses, net 246,814 243,796 226,301 20,556 Depreciation 20,458 19,779 Amortization of other intangible assets 22,079 24,688 25,760 Long-lived asset impairment charges Total operating costs and expenses 149 623 1,484 432,535 438,108 451,051 Equity Method Investment, Summarized Financial Information, Income Statement [Abstract] Net income, excluding impairment 14,846 14,552 12,555 Impairment charge (54,300) 0 0 Net income (loss) of equity method investments (41,745) 14,846 14,552 Other operating income, net 9,381 1,430 7,838 Operating income Other income (expense), net 319,567 338,858 414,714 Interest income 582 424 274 (96,765) (20,554) (1,084) (68,098 (13,735 (1,566 (83,125 Interest expense (100,852) Loss on debt extinguishment and refinancing transactions 0 Other losses, net (1,195) Total other expense, net (101,465) (117,979) Income before income taxes 201,588 313,249 255,733 Provision for income taxes 117,673 96,359 80,170 Net income including noncontrolling interests 195,576 105,229 175,563 Net income (loss) attributable to noncontrolling interests (794 0 2 $ 176,357 $ 195,576 $105,227 Net income attributa ble to Dunkin' Brands Earnings per share: Common-basic (in dollars per share) Common-diluted (in dollars per share) $ 2.14 $1.10 $1.67 2.11 1.08 1.65 Cash dividends declared per common share (in dollars per share) $1.20 $1.06 $0.92 Consolidated Balance Sheets USD ($) $in Dec. 31, 2016 Dec. 26, 2015 Current assets: $ 361,425 $ 260,430 Cash and cash equivalents 71,917 Restricted cash 69,746 Accounts receivable, net 53,142 44,512 Notes and other receivables, net 40,672 75,218 Restricted assets of advertising funds 40,338 38,554 Prepaid income taxes 20,926 23,899 28,739 Prepaid expenses and other current assets 34,664 Total current assets 606,358 557,824 176,662 Property and equipment, net 182,614 Equity method investments 114,738 106,878 Goodwill 888,272 889,588 Other intangible assets, net 1,378,720 1,401,208 Other assets 59,007 62,632 Total assets 3,227,382 3,197,119 Current liabilities: Current portion of long-term debt 25,000 25,000 Capital lease obligations Accounts payable 589 546 18,663 12,682 Liabilities of advertising funds 52,271 50,189 Deferred income 35,393 31,535 Other current liabilities 298,266 292,859 Total current liabilities 424,201 418,792 Long-term debt, net Capital lease obligations Unfavorable operating leases acquired 2,401,998 2,420,600 7,550 7,497 11,378 12,975 Deferred income 12,154 15,619 Deferred income taxes, net 461,810 476,510 Other long-term liabilities 71,549 65,869 2,999,070 Total long-term liabilities 2,966,439 Stockholders' deficit: Preferred stock, $0.001 par value; 25,000,000 shares 0 authorized; no shares issued and outstanding Common stock, $0.001 par value; 475,000,000 shares 91 92 authorized; 91,464,229 shares issued and 91,437,452 shares outstanding at December 31, 2016; 92,668,211 Additional paid-in capital 807,492 876,557 Treasury stock, at cost; 26,777 shares and 27,167 (1,060) (1,075) shares at December 31, 2016 and December 26, 2015, (1,076,479) Accumulated deficit (945,797) Accumulated other comprehensive loss (23,984) (20,046) Total stockholders' deficit of Dunkin' Brands (163,258) (220,951) Noncontrolling interests 0 208 Total stockholders' deficit (163,258) (220,743) $3,227,382 $3,197,119 Total liabilities and stockholders' deficit Consolidated Balance Sheets USD ($) $ Oct. 01, 2017 Oct. 02, 2016 in Millions Current assets: $2,462.3 $2,128.8 Cash and cash equivalents Short-term investments 134.4 228.6 Accounts receivable, net 870.4 768.8 Inventories 1,364 1,378.5 Prepaid expenses and other current assets 347.4 358.1 Total current assets 5,283.4 4,757.9 542.3 Long-term investments 1,141.7 Equity and cost investments 481.6 354.5 Property, plant and equipment, net 4,919.5 4,533.8 Deferred income taxes, net 795.4 885.4 Other long-term assets 403.3 362.8 Other intangible assets 441.4 516.3 Goodwill 1,539.2 1,719.6 TOTAL ASSETS 14,365.6 14,312.5 Current liabilities: Accounts payable 782.5 730.6 Accrued liabilities 1,934.5 1,999.1 215.2 Insurance reserves 246 Stored value card liability 1,288.5 1,171.2 Current portion of long-term debt 0 399.9 Total current liabilities 4,220.7 4,546.8 3,185.3 Long-term debt 3,932.6 Other long-term liabilities 755.3 689.7 Total liabilities 8,908.6 8,421.8 Shareholders' equity: Common stock ($0.001 par value) 1.4 1.5 authorized, 2,400.0 shares; issued and Additional paid-in capital Retained earnings 41.1 41.1 5,563.2 5,949.8 Accumulated other comprehensive (155.6) (108.4) Total shareholders' equity 5,450.1 5,884 Noncontrolling interests 6.9 6.7 Total equity 5,457 5,890.7 $14,365.6 $14,312.5 TOTAL LIABILITIES AND EQUITY Consolidated Statements of Earnings USD ($) shares in Millions, $in Millions 12 Months Ended Oct. 01, 2017 Oct. 02, 2016 Sep. 27, 2015 Net Revenues: $ 22,386.8 $ 21,315.9 $19,162.7 Total net revenues Cost of sales including occupancy costs 9,038.2 8,511.1 7,787.5 Store operating expenses Other operating expenses Depreciation and amortization expenses General and administrative expenses 6,064.3 5,411.1 6,493.3 522.4 553.8 545.4 1,011.4 980.8 893.9 1,196.7 1,393.3 1,360.6 Total operating expenses 18,643.5 17,462.2 15,811.6 Income from equity investees 249.9 391.4 318.2 Operating income 3,601 4,134.7 4,171.9 Gain resulting from acquisition of joint venture 0 0 390.6 Loss on extinguishment of debt (61.1) 0 0 Interest income and other, net 275.3 108 43 (92.5) (81.3) (70.5) Interest expense Earnings before income taxes 4,317.5 4,198.6 3,903 Income tax expense 1,432.6 1,379.7 1,143.7 Net earnings including noncontrolling interests Net earnings/(loss) attributable to noncontrolling interests 2,884.9 2,818.9 2,759.3 0.2 1.2 1.9 $2,884.7 $2,817.7 $2,757.4 Net earnings attributable to Starbucks Earnings per share - basic Earnings per share - diluted $1.99 $1.91 $1.84 $1.97 $1.90 $1.82 Weighted average shares outstanding: Basic 1,449.5 1,471.6 1,495.9 Diluted 1,461.5 1,486.7 1,513.4 $ 0 $ 0 $153.5 Restructuring Charges Company-operated stores [Member] Net Revenues Total net revenues 17,650.7 16,844.1 15,197.3 Licensed stores [Member] Net Revenues: Total net revenues 2,355 2,154.2 1,861.9 CPG, foodservice and other [Member] Net Revenues: $2,381.1 $2,317.6 $2,103.5 Total net revenues Consolidated Statements of Operations USD ($) $ in 12 Months Ended Thousands Dec. 31, 2016 Dec. 27, 2014 Dec. 26, 2015 Revenues: Franchise fees and royalty income $549,571 $513,222 $ 482,329 Rental income 101,020 100,422 97,663 Sales of ice cream and other products 114,857 115,252 117,484 Sales at company-operated restaurants 11,975 28,340 22,206 Other revenues 53,697 51,466 29,027 Total revenues 810,933 828,889 748,709 Operating costs and expenses: Occupancy expenses-franchised restaurants Cost of ice cream and other products 54,611 57,409 53,395 77,608 76,877 83,129 Company-owned restaurant expenses 29,900 13,591 22,687 General and administrative expenses, net 246,814 243,796 226,301 20,556 Depreciation 20,458 19,779 Amortization of other intangible assets 22,079 24,688 25,760 Long-lived asset impairment charges Total operating costs and expenses 149 623 1,484 432,535 438,108 451,051 Equity Method Investment, Summarized Financial Information, Income Statement [Abstract] Net income, excluding impairment 14,846 14,552 12,555 Impairment charge (54,300) 0 0 Net income (loss) of equity method investments (41,745) 14,846 14,552 Other operating income, net 9,381 1,430 7,838 Operating income Other income (expense), net 319,567 338,858 414,714 Interest income 582 424 274 (96,765) (20,554) (1,084) (68,098 (13,735 (1,566 (83,125 Interest expense (100,852) Loss on debt extinguishment and refinancing transactions 0 Other losses, net (1,195) Total other expense, net (101,465) (117,979) Income before income taxes 201,588 313,249 255,733 Provision for income taxes 117,673 96,359 80,170 Net income including noncontrolling interests 195,576 105,229 175,563 Net income (loss) attributable to noncontrolling interests (794 0 2 $ 176,357 $ 195,576 $105,227 Net income attributa ble to Dunkin' Brands Earnings per share: Common-basic (in dollars per share) Common-diluted (in dollars per share) $ 2.14 $1.10 $1.67 2.11 1.08 1.65 Cash dividends declared per common share (in dollars per share) $1.20 $1.06 $0.92
Step by Step Solution
There are 3 Steps involved in it

Get step-by-step solutions from verified subject matter experts