

Question: How am I supposed to correctly do the pivot table using data in this chart attached? What I am currently doing is not creating the
How am I supposed to correctly do the pivot table using data in this chart attached? What I am currently doing is not creating the table correctly?
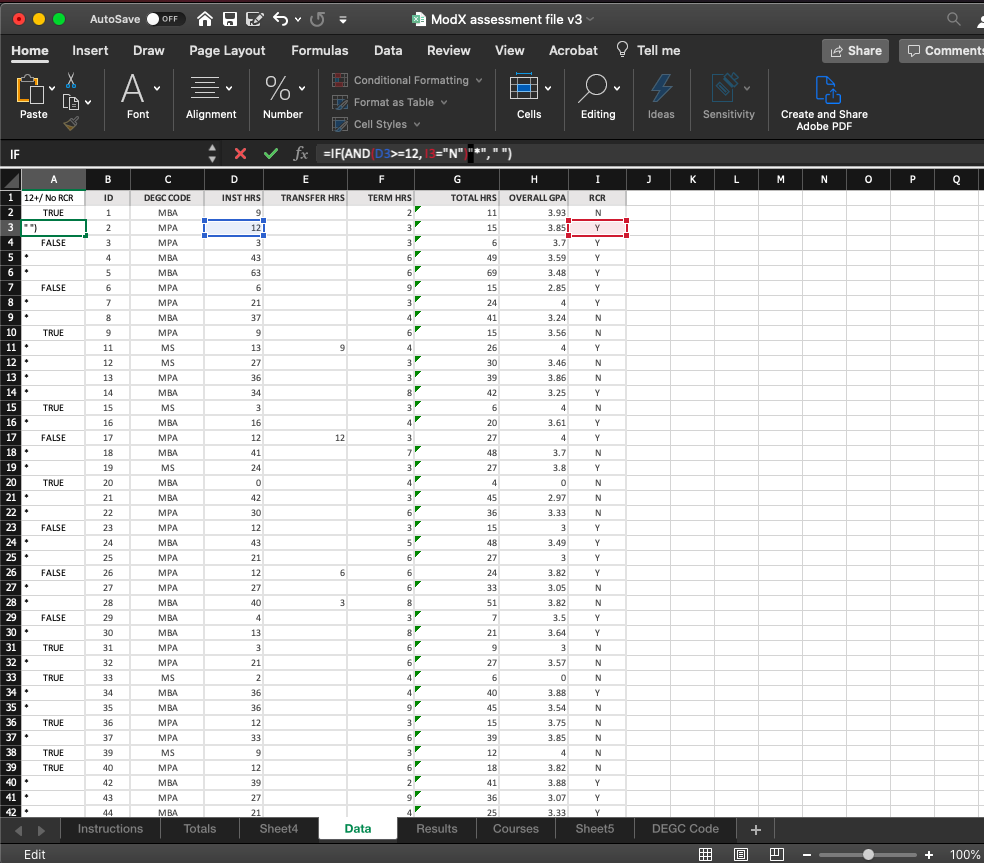
AutoSave O OFF A A B 6 - U 3 ModX assessment file v3 Home Insert Draw Page Layout Formulas Data Review View Acrobat Tell me Share Comment X A Conditional Formatting Format as Table Paste Font Alignment Number Cell Styles Cells Editing Ideas Sensitivity Create and Share Adobe PDF IF X V fx =IF(AND (D3>=12, 13="N")"* B C D G H K M N 0 P Q 12+/ No RCR ID DEGC CODE INST HRS TRANSFER HRS TERM HRS TOTAL HRS OVERALL GPA RCR TRUE MBA 11 3.93 N MPA 3.851 Y FALSE MPA 3.7 MBA 49 3.59 MBA 69 3.48 FALSE MPA 15 2.85 MPA 24 MBA 41 3.24 TRUE MPA 15 .56 11 MS 26 12 MS 13 MPA 14 MBA 1.25 TRUE 15 MS -2 2 -2 2 16 MBA .61 FALSE 17 MPA 12 18 MBA 19 MS TRUE 20 MBA 21 MBA 22 MPA FALSE 23 MPA 2 2 2 -2 24 MBA 25 MP ALSE 26 MPA MPA 28 MBA FALSE 29 MBA 2 2 30 MBA TRUE 31 MPA 32 MPA TRUE 33 MS 34 MBA 3.88 35 MBA 3.54 TRUE 36 MPA 3.75 37 MPA 1.85 TRUE 39 M TRUE MPA 3.82 42 MBA 3.88 2 2 2 2 2 -2 2 2- 43 MPA 3.07 MBA 3.33 Instructions Totals Sheet4 Data Results Courses Sheet5 DEGC Code + Edit HH 100%
Step by Step Solution
There are 3 Steps involved in it

Get step-by-step solutions from verified subject matter experts