

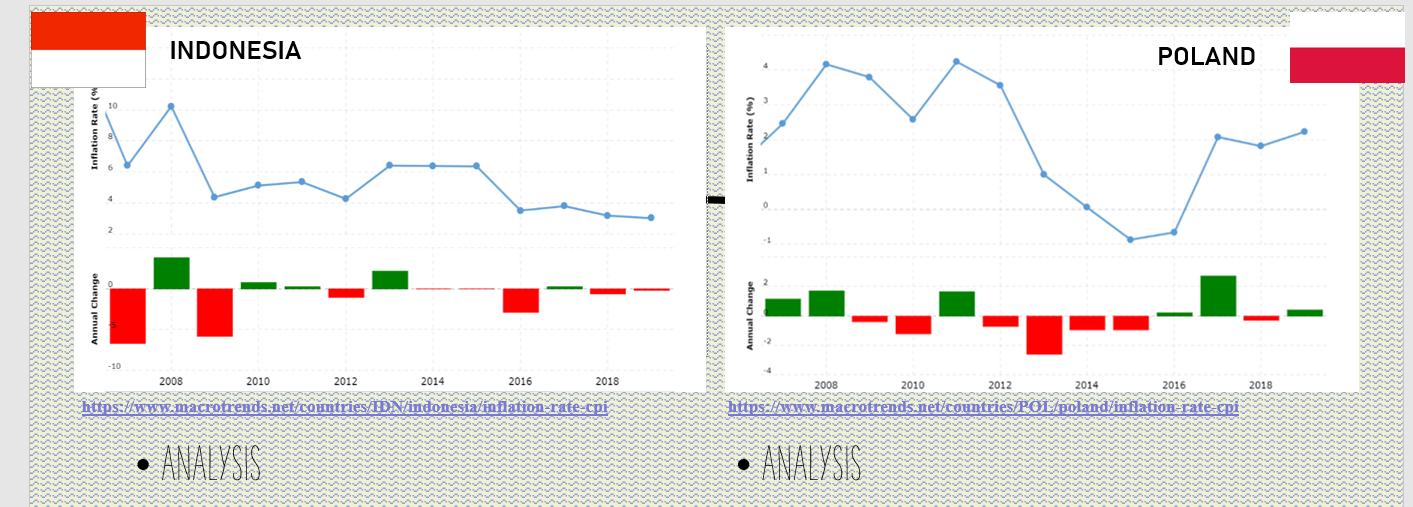
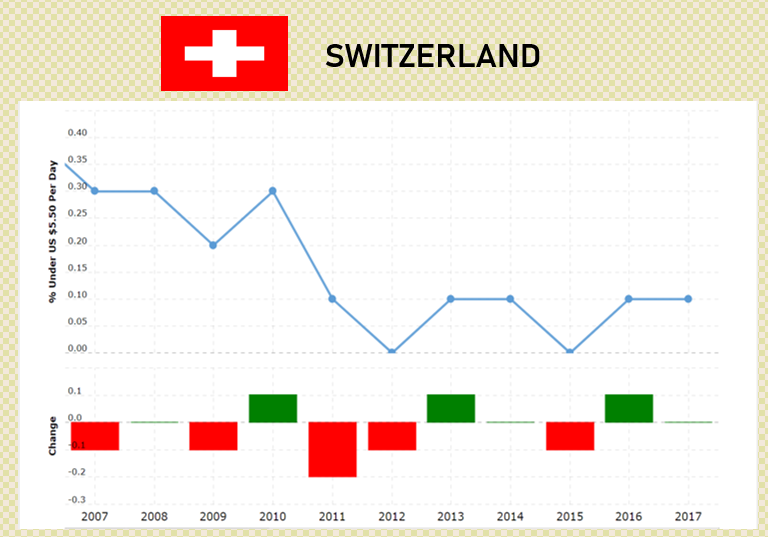
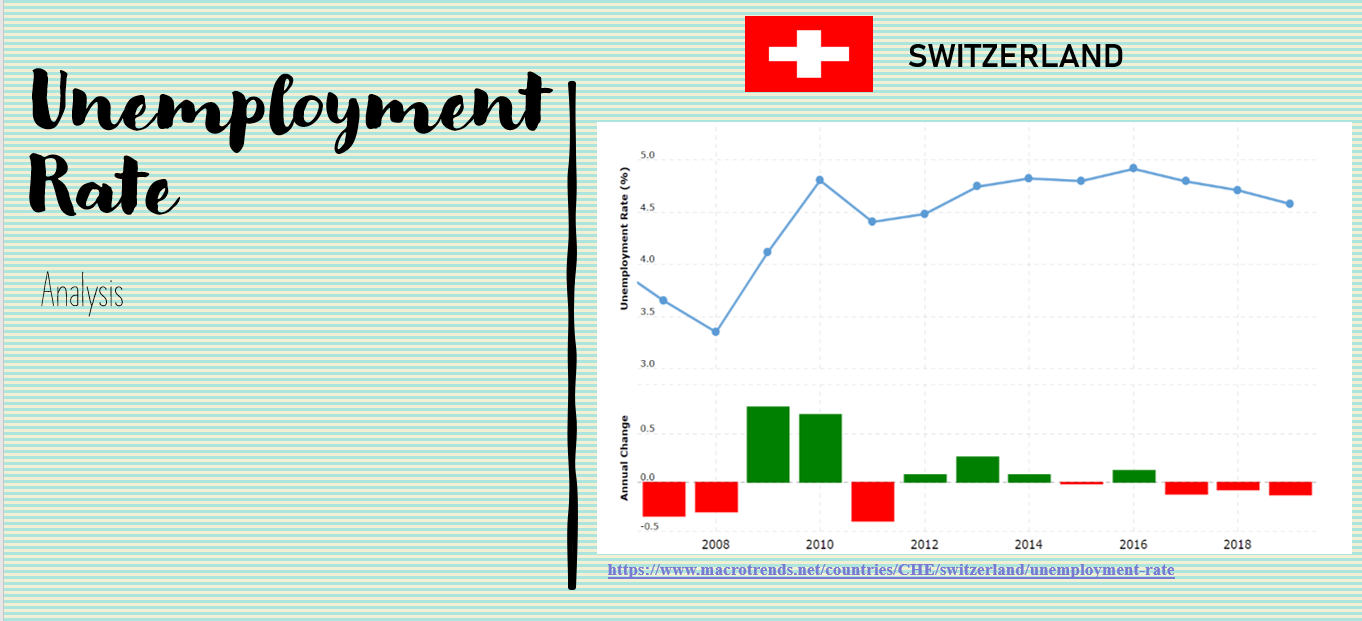
Question: How can i analyze and explain what is occurring in the graph, i understand a bit of line graph but it is confusing when it
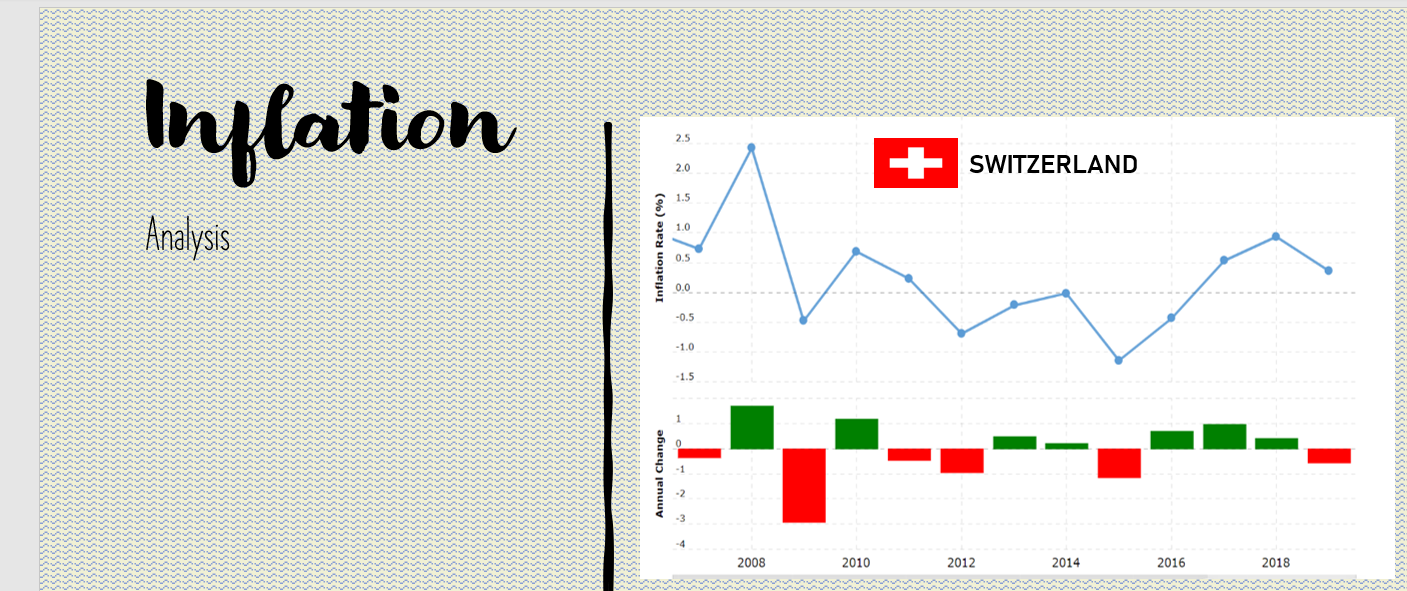


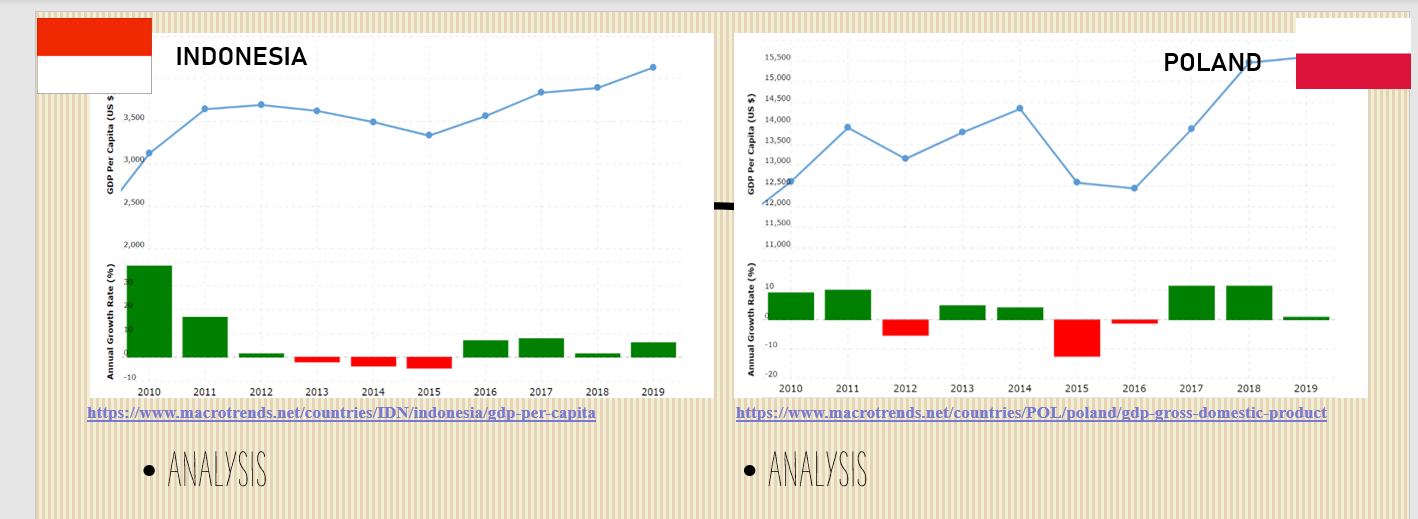
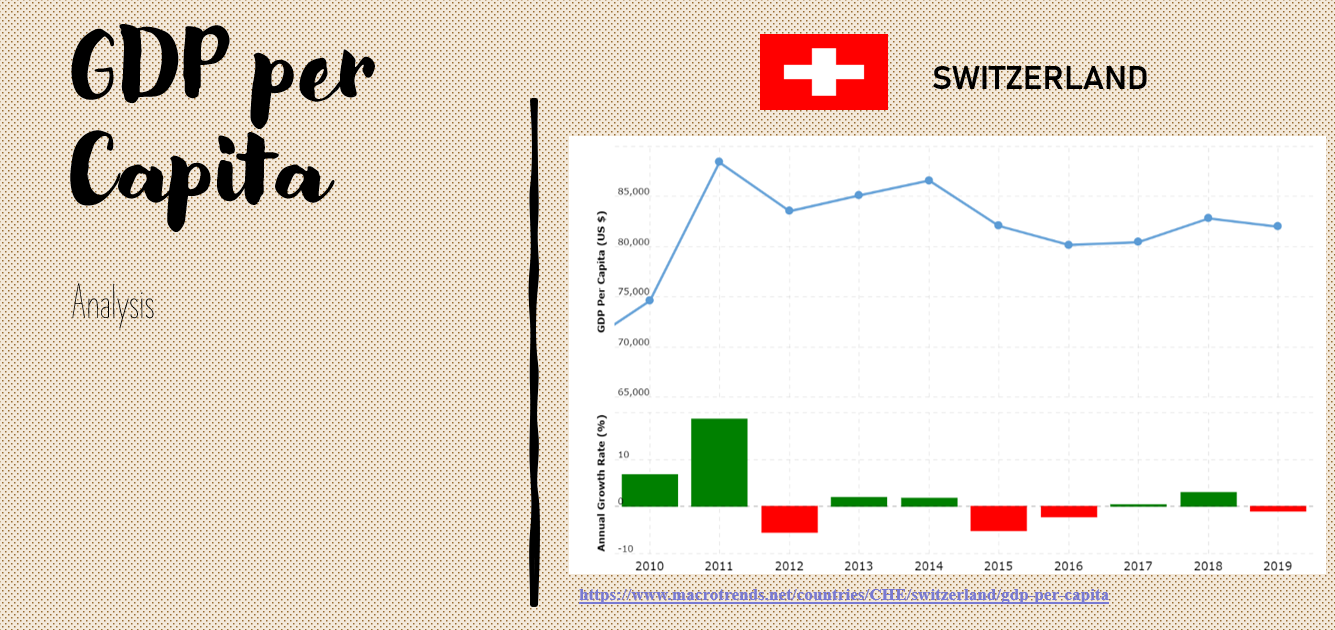
How can i analyze and explain what is occurring in the graph, i understand a bit of line graph but it is confusing when it has both line and bar. I understand there is a fluctuation and downward trend but is that it? with how many % increase or decrease between a and b year? What is the Fiscal and monetary policy in this analysis?


Step by Step Solution
There are 3 Steps involved in it
1 Expert Approved Answer
Step: 1 Unlock

Question Has Been Solved by an Expert!
Get step-by-step solutions from verified subject matter experts
Step: 2 Unlock
Step: 3 Unlock