

Question: How can I create a program about this? fMango Production In 2019, the Cooperative Research Centre for Developing Northern Australia launched a project to boost
How can I create a program about this?
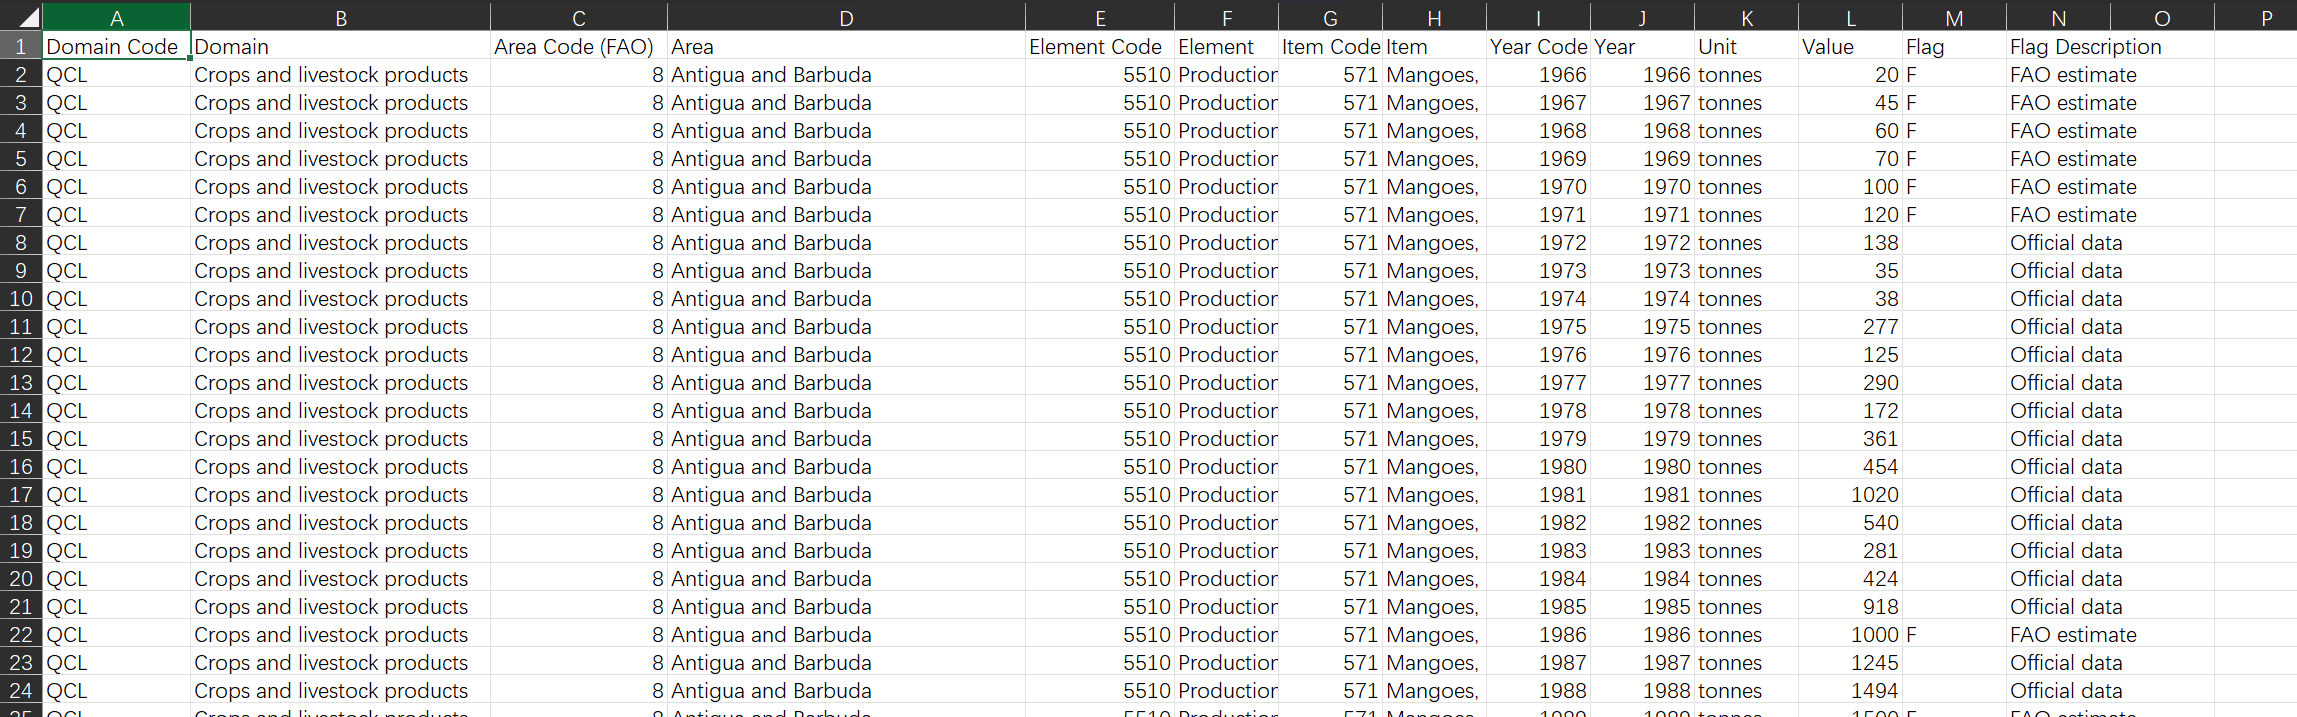
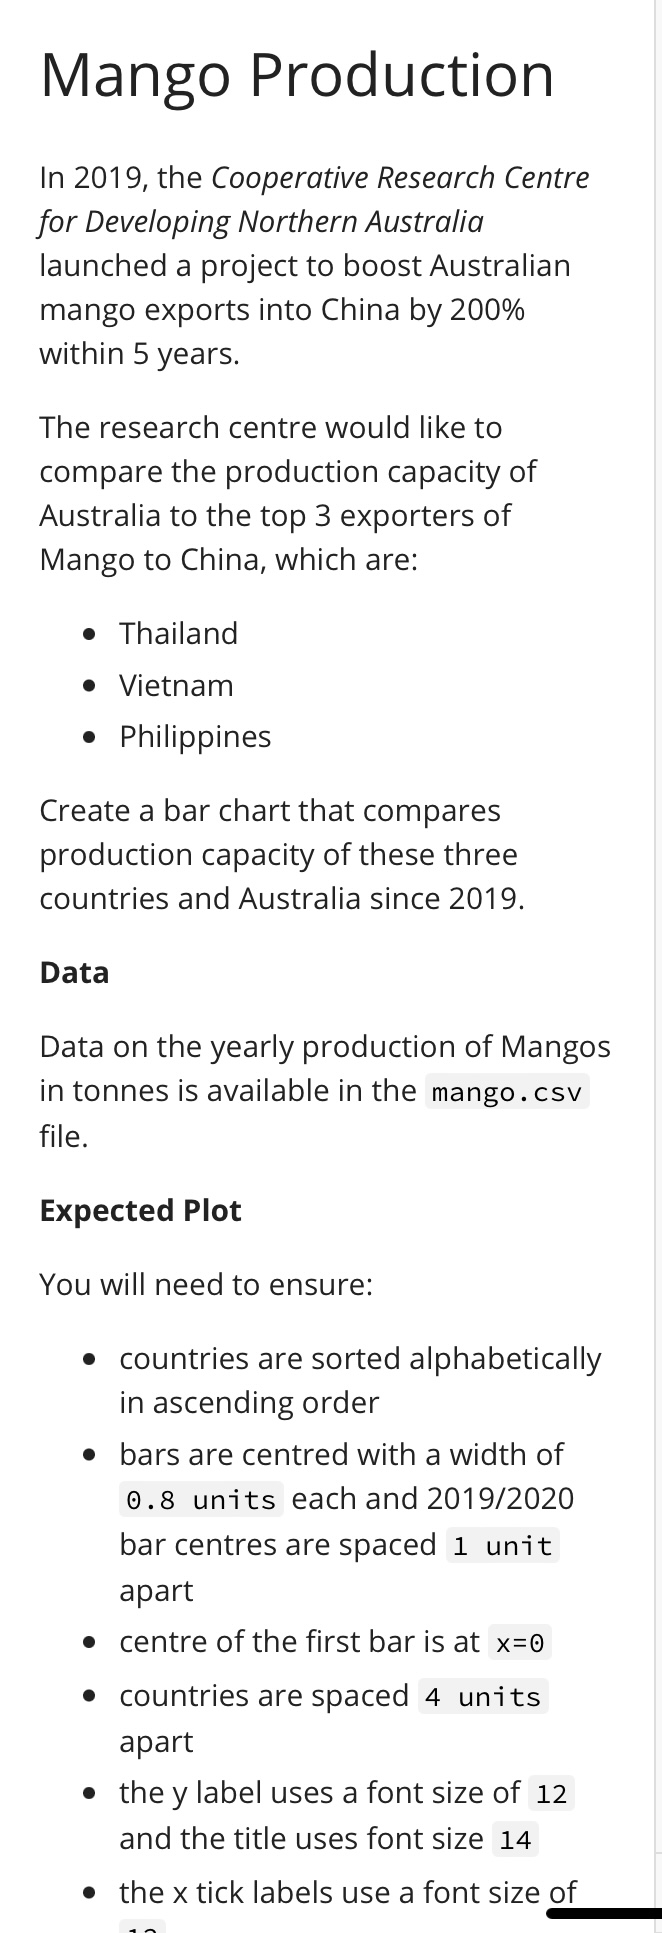
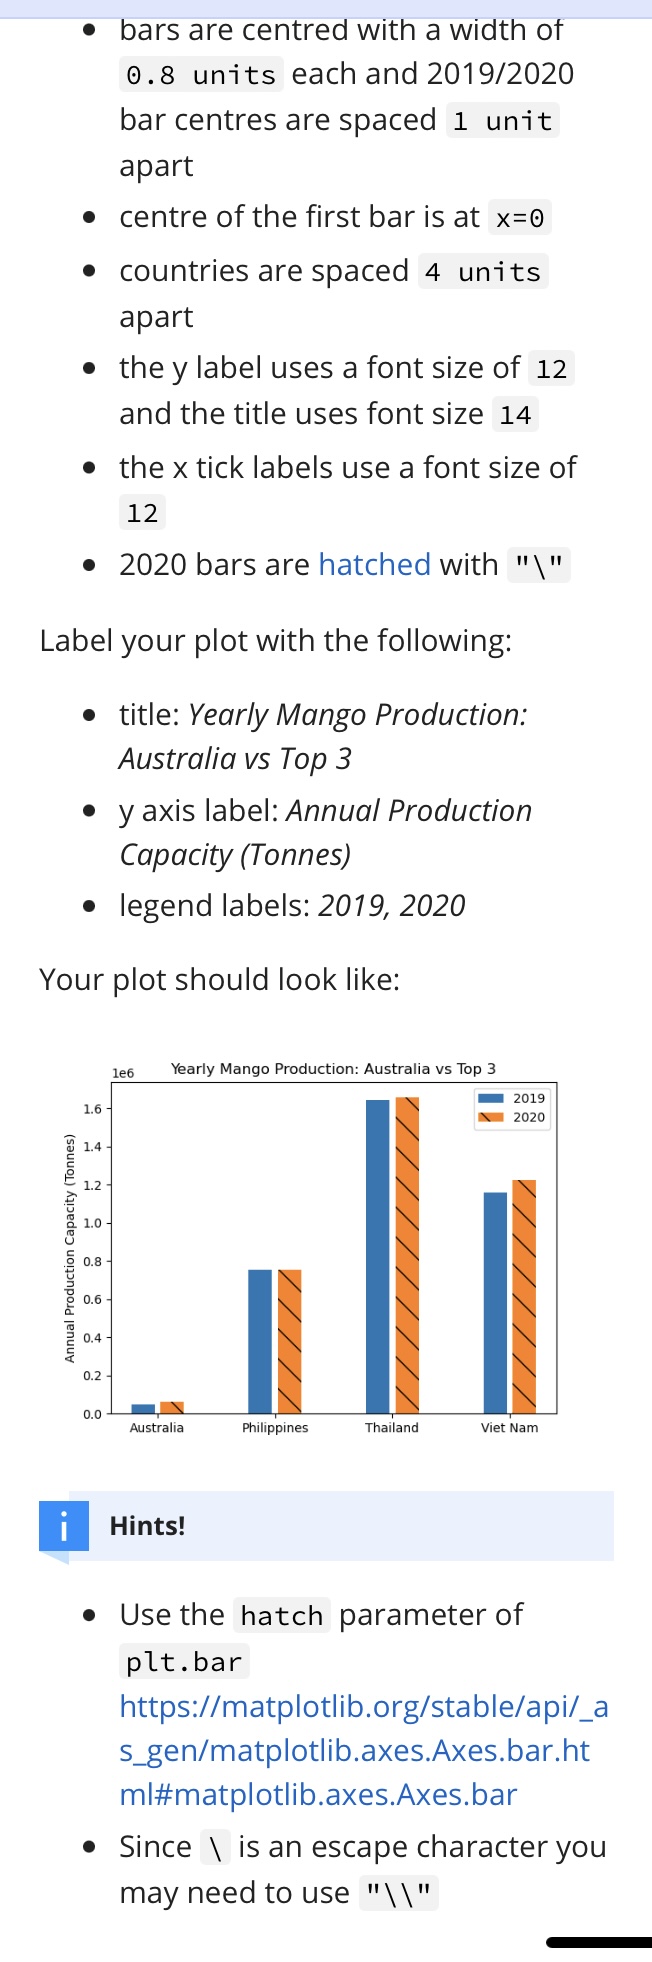
\fMango Production In 2019, the Cooperative Research Centre for Developing Northern Australia launched a project to boost Australian mango exports into China by 200% within 5 years. The research centre would like to compare the production capacity of Australia to the top 3 exporters of Mango to China, which are: ThaHand Vietnam Philippines Create a bar chart that compares production capacity ofthese three countries and Australia since 2019. Data Data on the yearly production of Mangos in tonnes is available in the mango. csv file. Expected Plot You will need to ensure: countries are sorted alphabetically in ascending order bars are centred with a width of 0.8 units each and 2019/2020 bar centres are spaced 1 unit apart centre of the first bar is at x=0 countries are spaced 4 units apart the y label uses a font size of 12 and the title uses font size 14 the x tick labels use a font size of 1n \f
Step by Step Solution
There are 3 Steps involved in it

Get step-by-step solutions from verified subject matter experts