

Question: How can I develop a Time Series Chart and a Descriptive Data table in minitab. What can i infer on the behavior and trend of
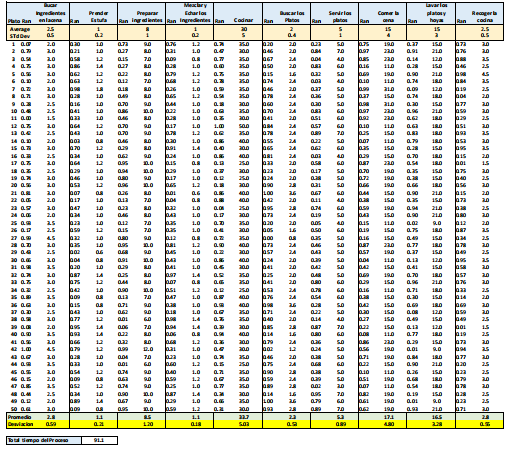
How can I develop a Time Series Chart and a Descriptive Data table in minitab.
What can i infer on the behavior and trend of values.
Please explain to me step by step. Thank you
\f
Step by Step Solution
There are 3 Steps involved in it
1 Expert Approved Answer
Step: 1 Unlock

Question Has Been Solved by an Expert!
Get step-by-step solutions from verified subject matter experts
Step: 2 Unlock
Step: 3 Unlock