

Question: How can I draw this graph 3. The supply and demand for honey (in gallons) is: 5(2)) =62? D0?) = 80 - 4p a. Solve

How can I draw this graph
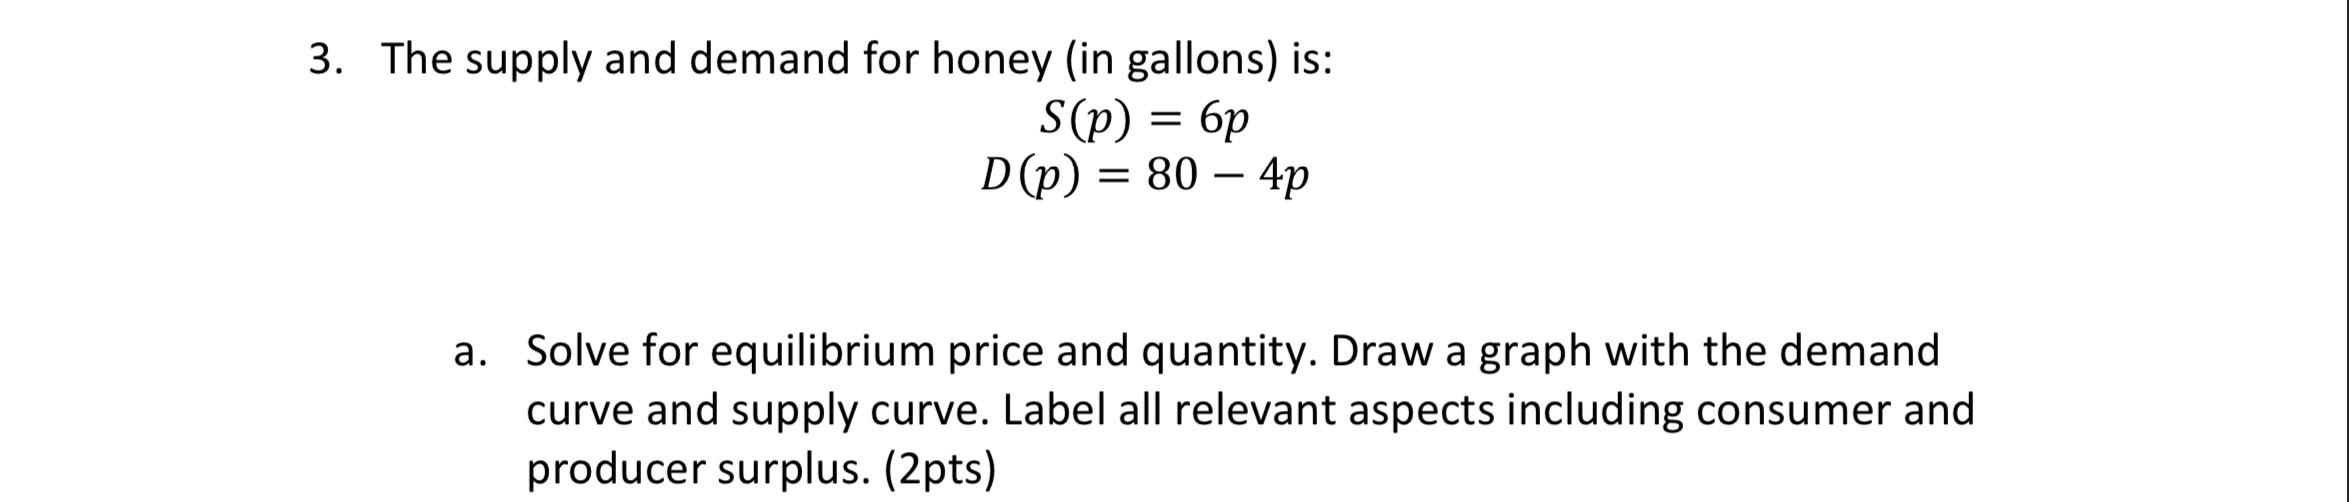
3. The supply and demand for honey (in gallons) is: 5(2)) =62? D0?) = 80 - 4p a. Solve for equilibrium price and quantity. Draw a graph with the demand curve and supply curve. Label all relevant aspects including consumer and producer surplus. (2pts)
Step by Step Solution
There are 3 Steps involved in it
1 Expert Approved Answer
Step: 1 Unlock

Question Has Been Solved by an Expert!
Get step-by-step solutions from verified subject matter experts
Step: 2 Unlock
Step: 3 Unlock