

Question: How can I explain and comment each graph clearly? Can someone help me? It is the hotel booking data through R studio application. Facebook .
How can I explain and comment each graph clearly? Can someone help me? It is the hotel booking data through R studio application.
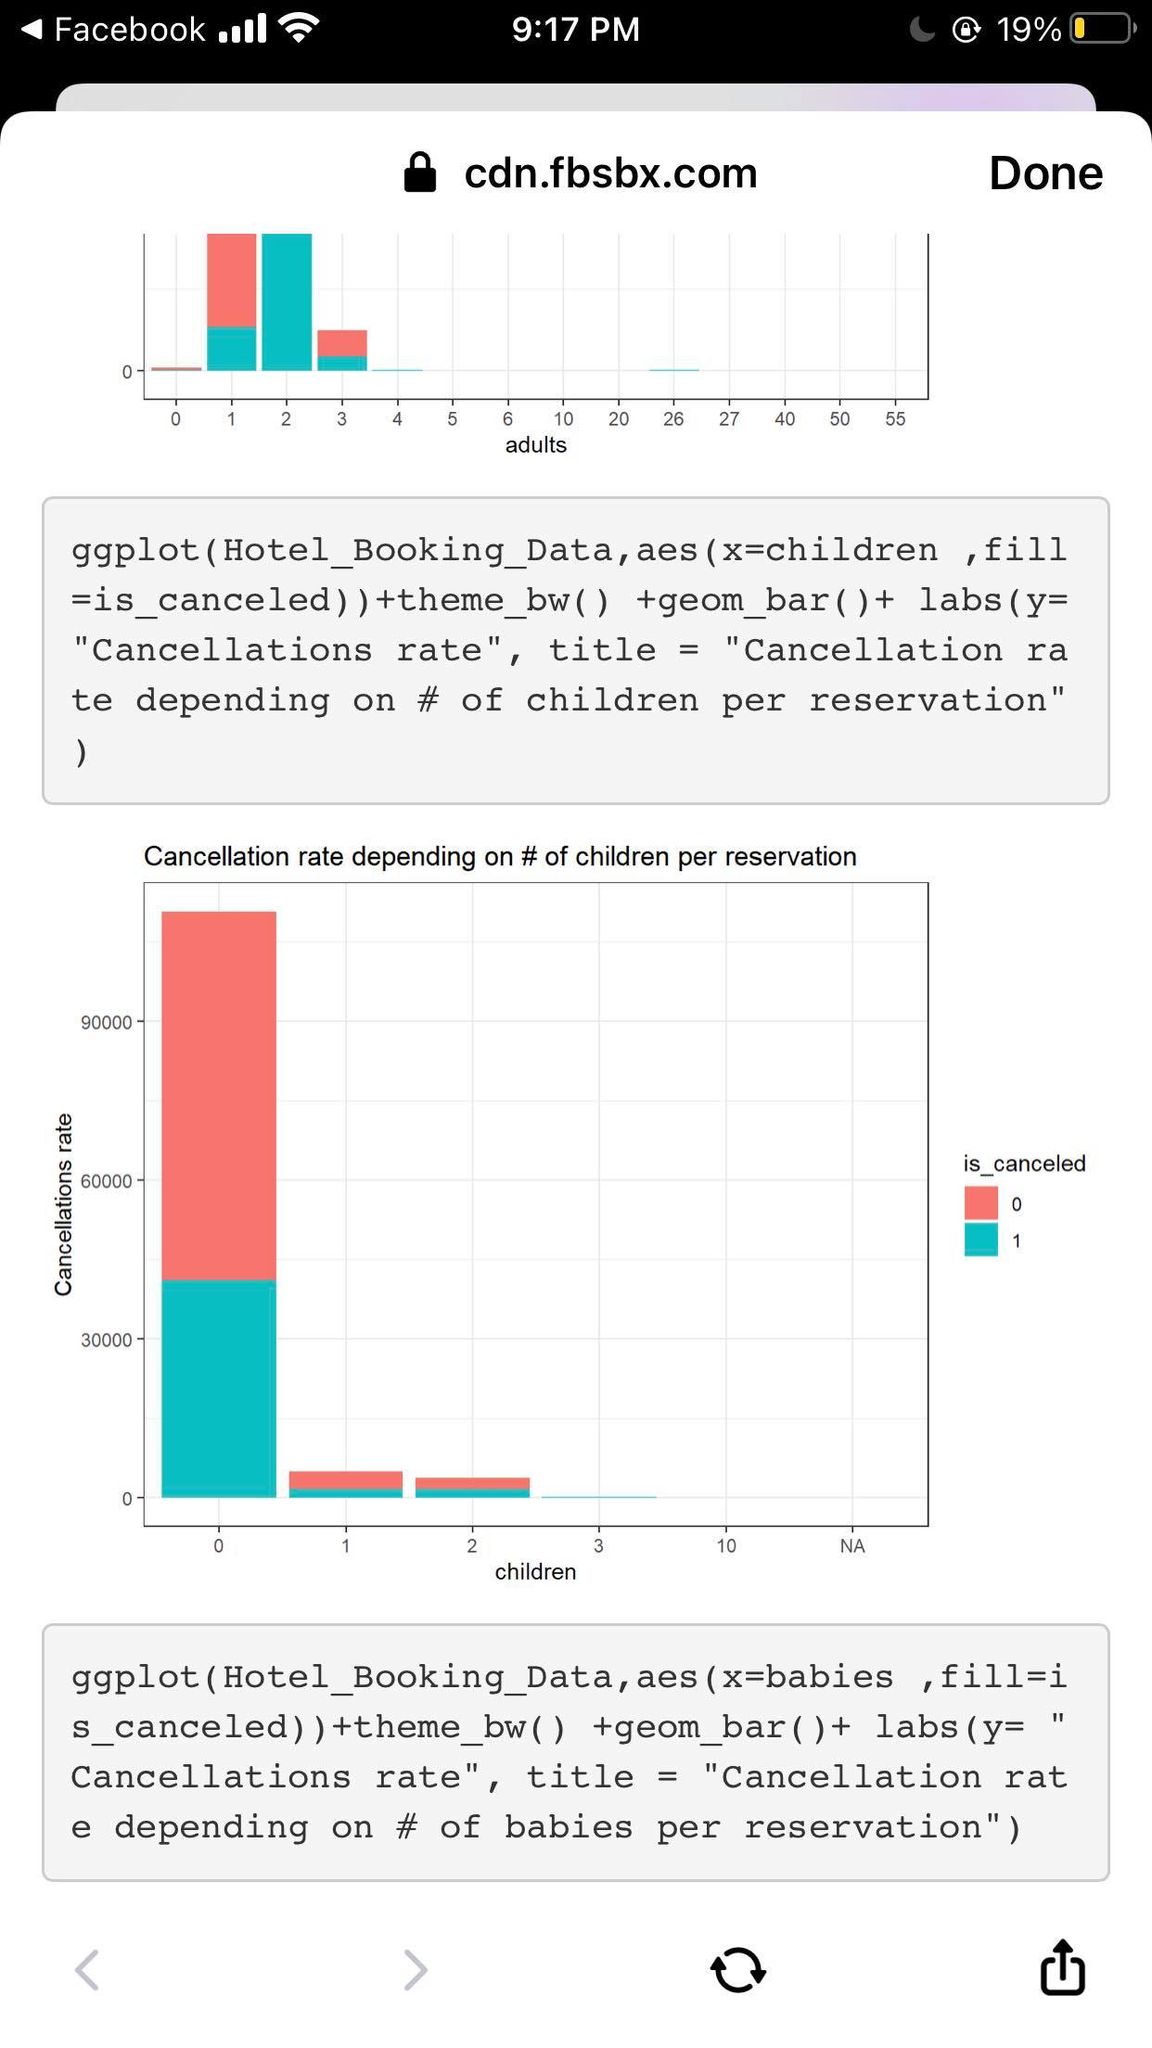
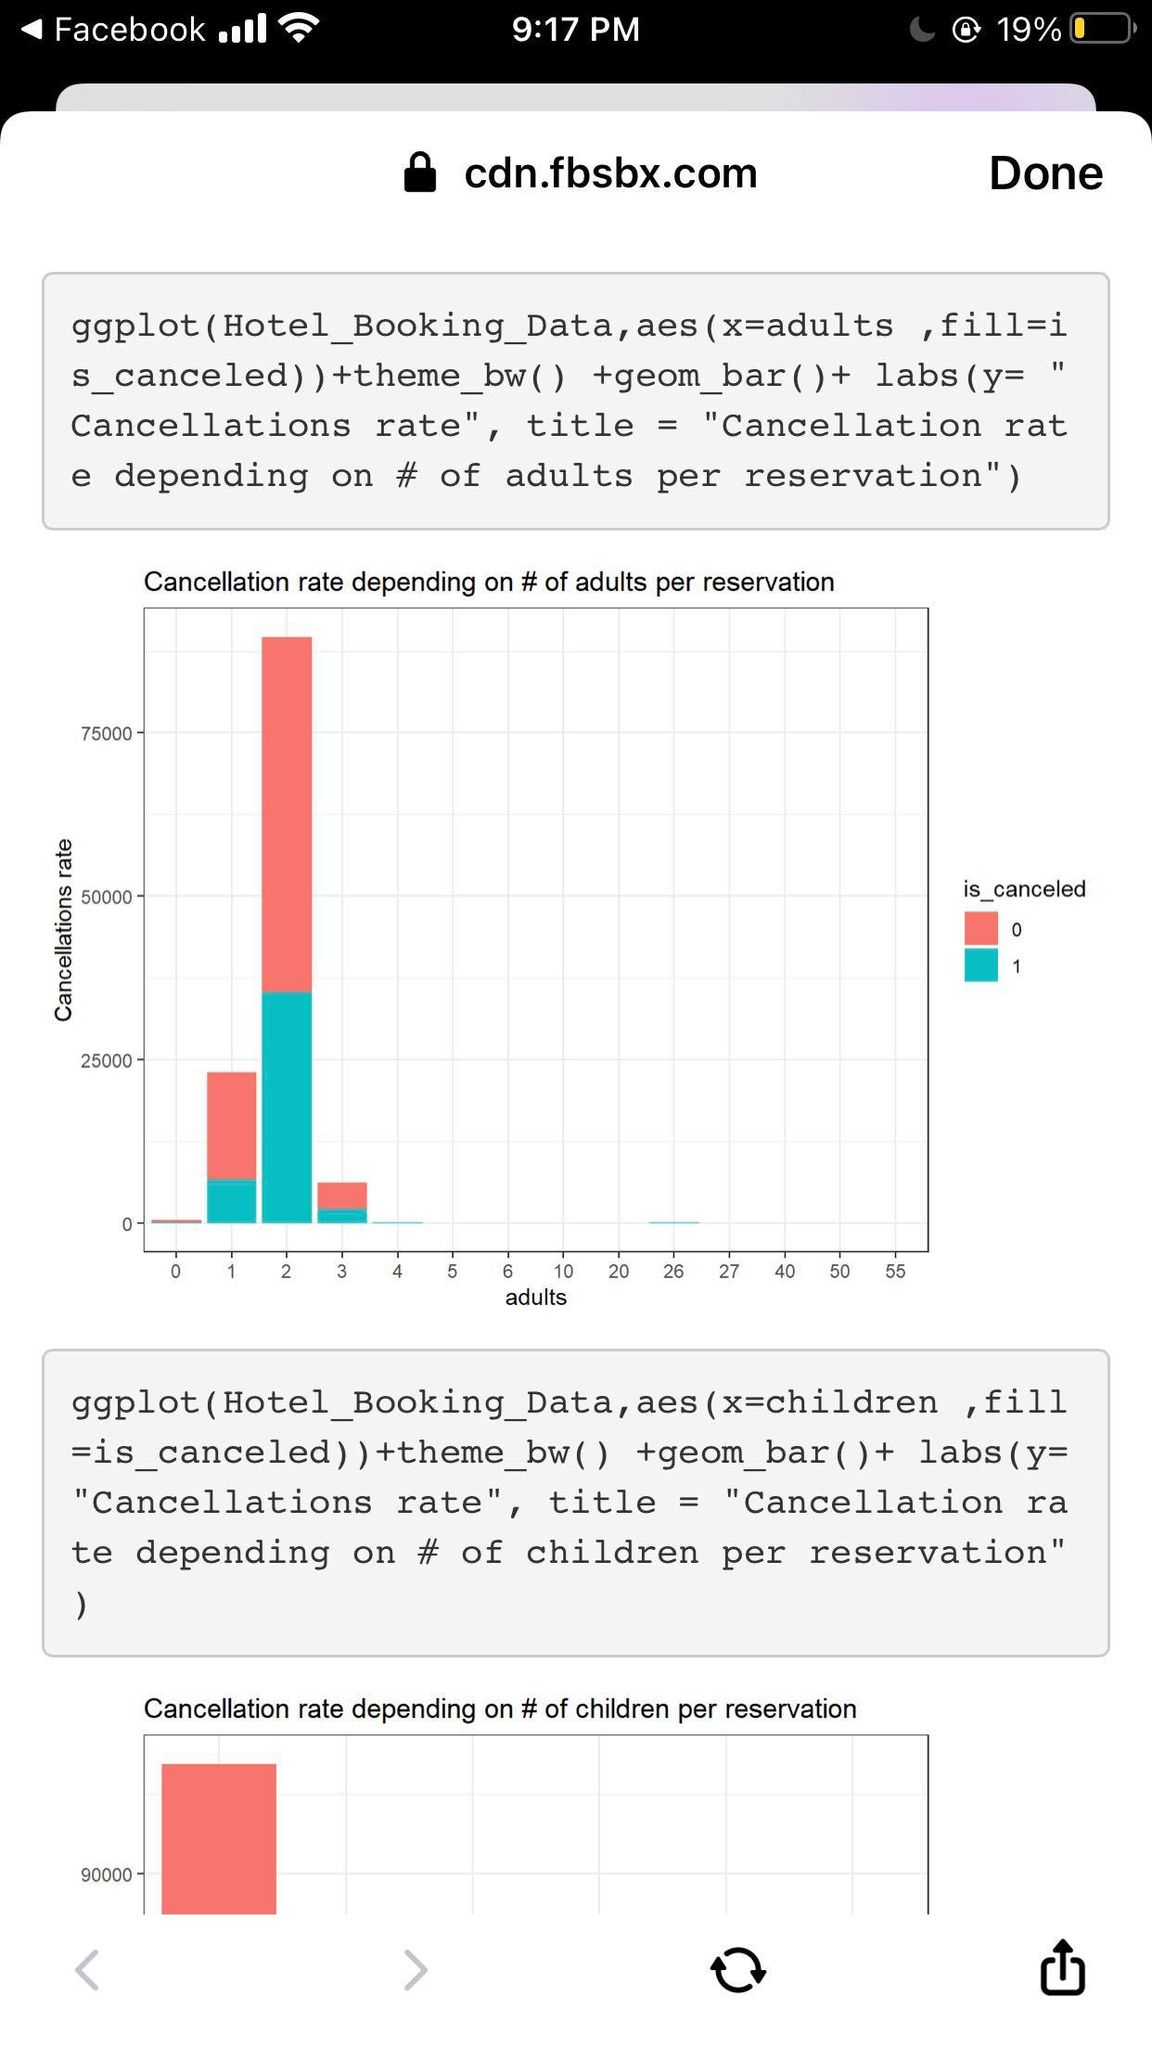
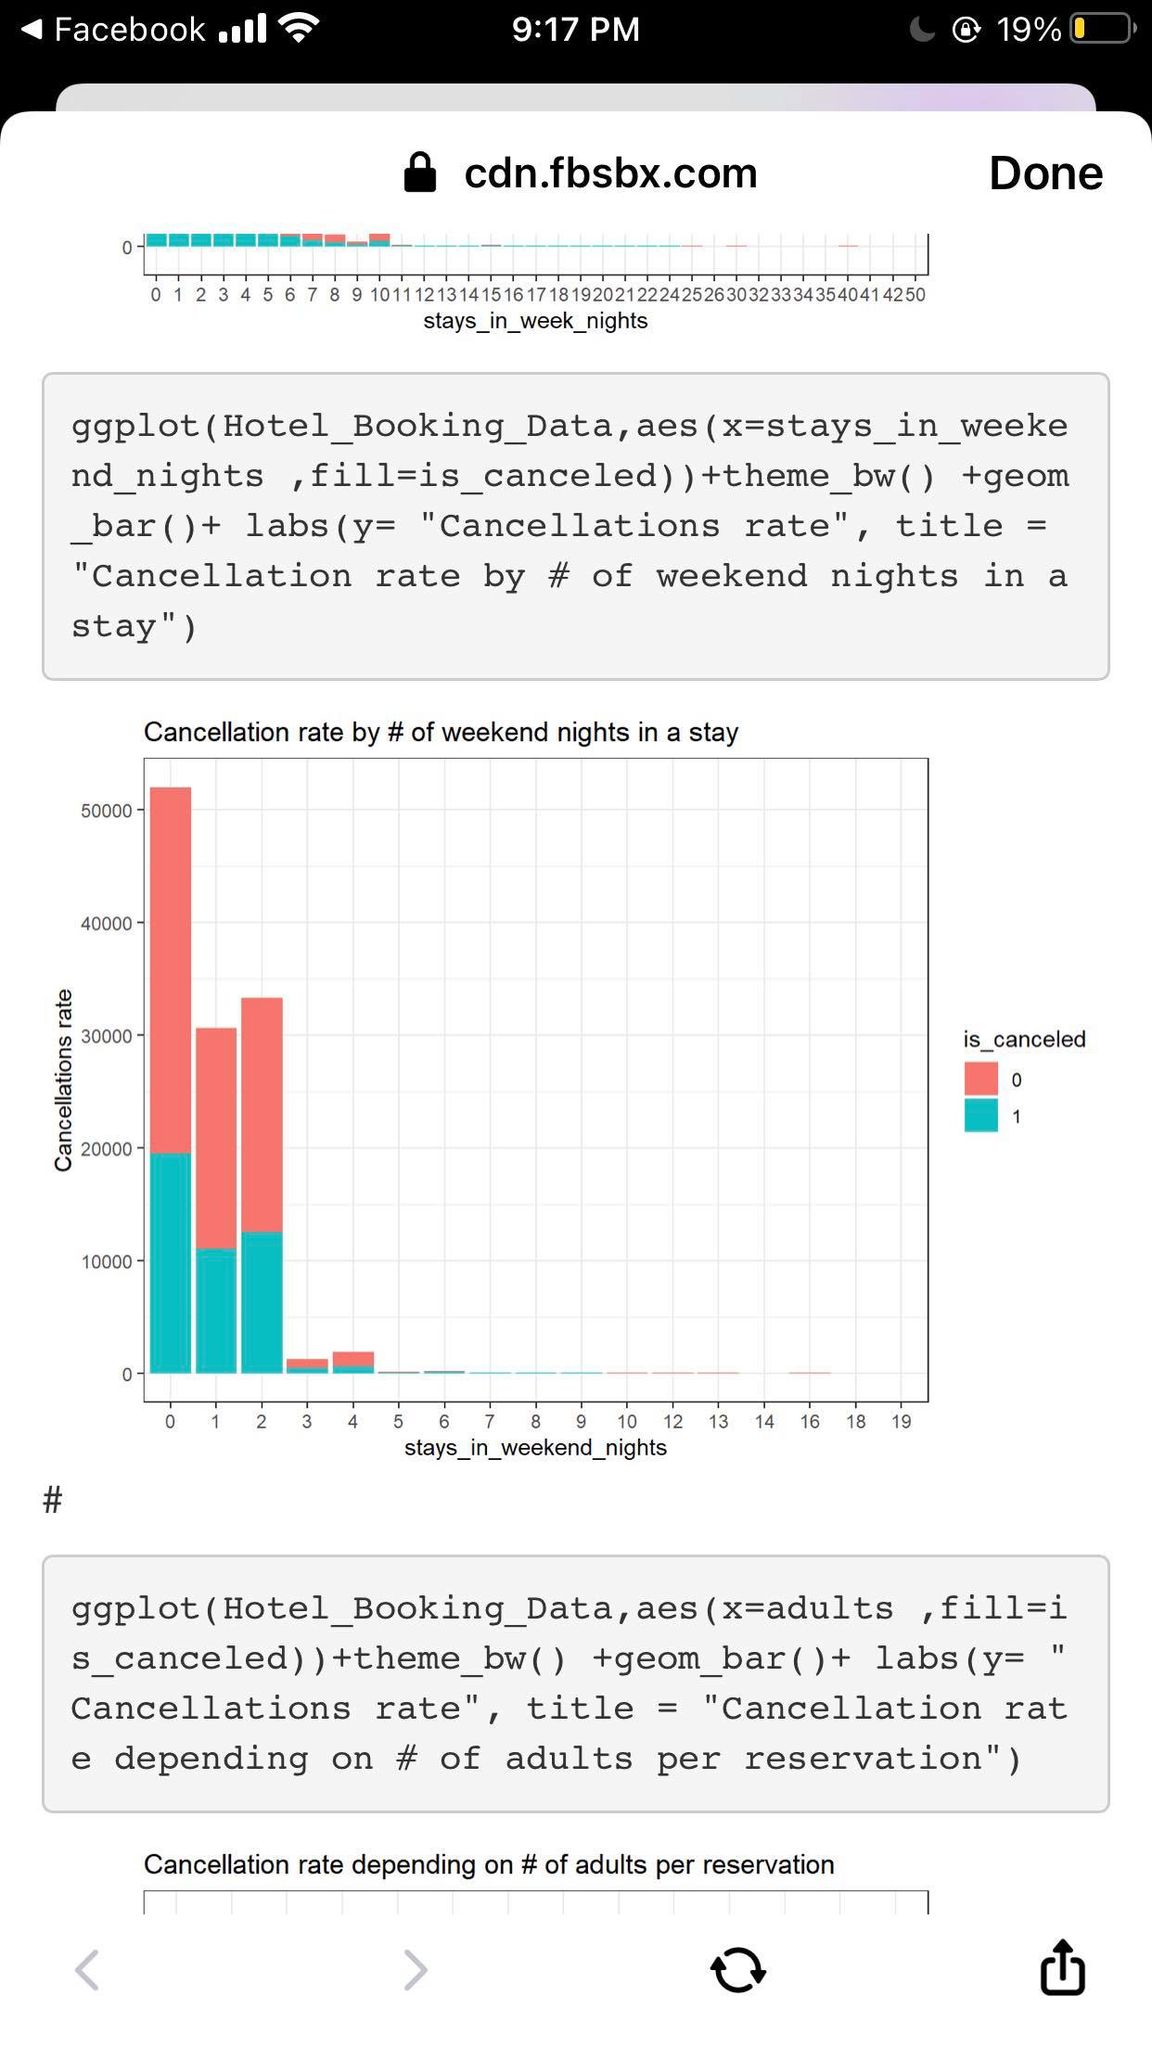
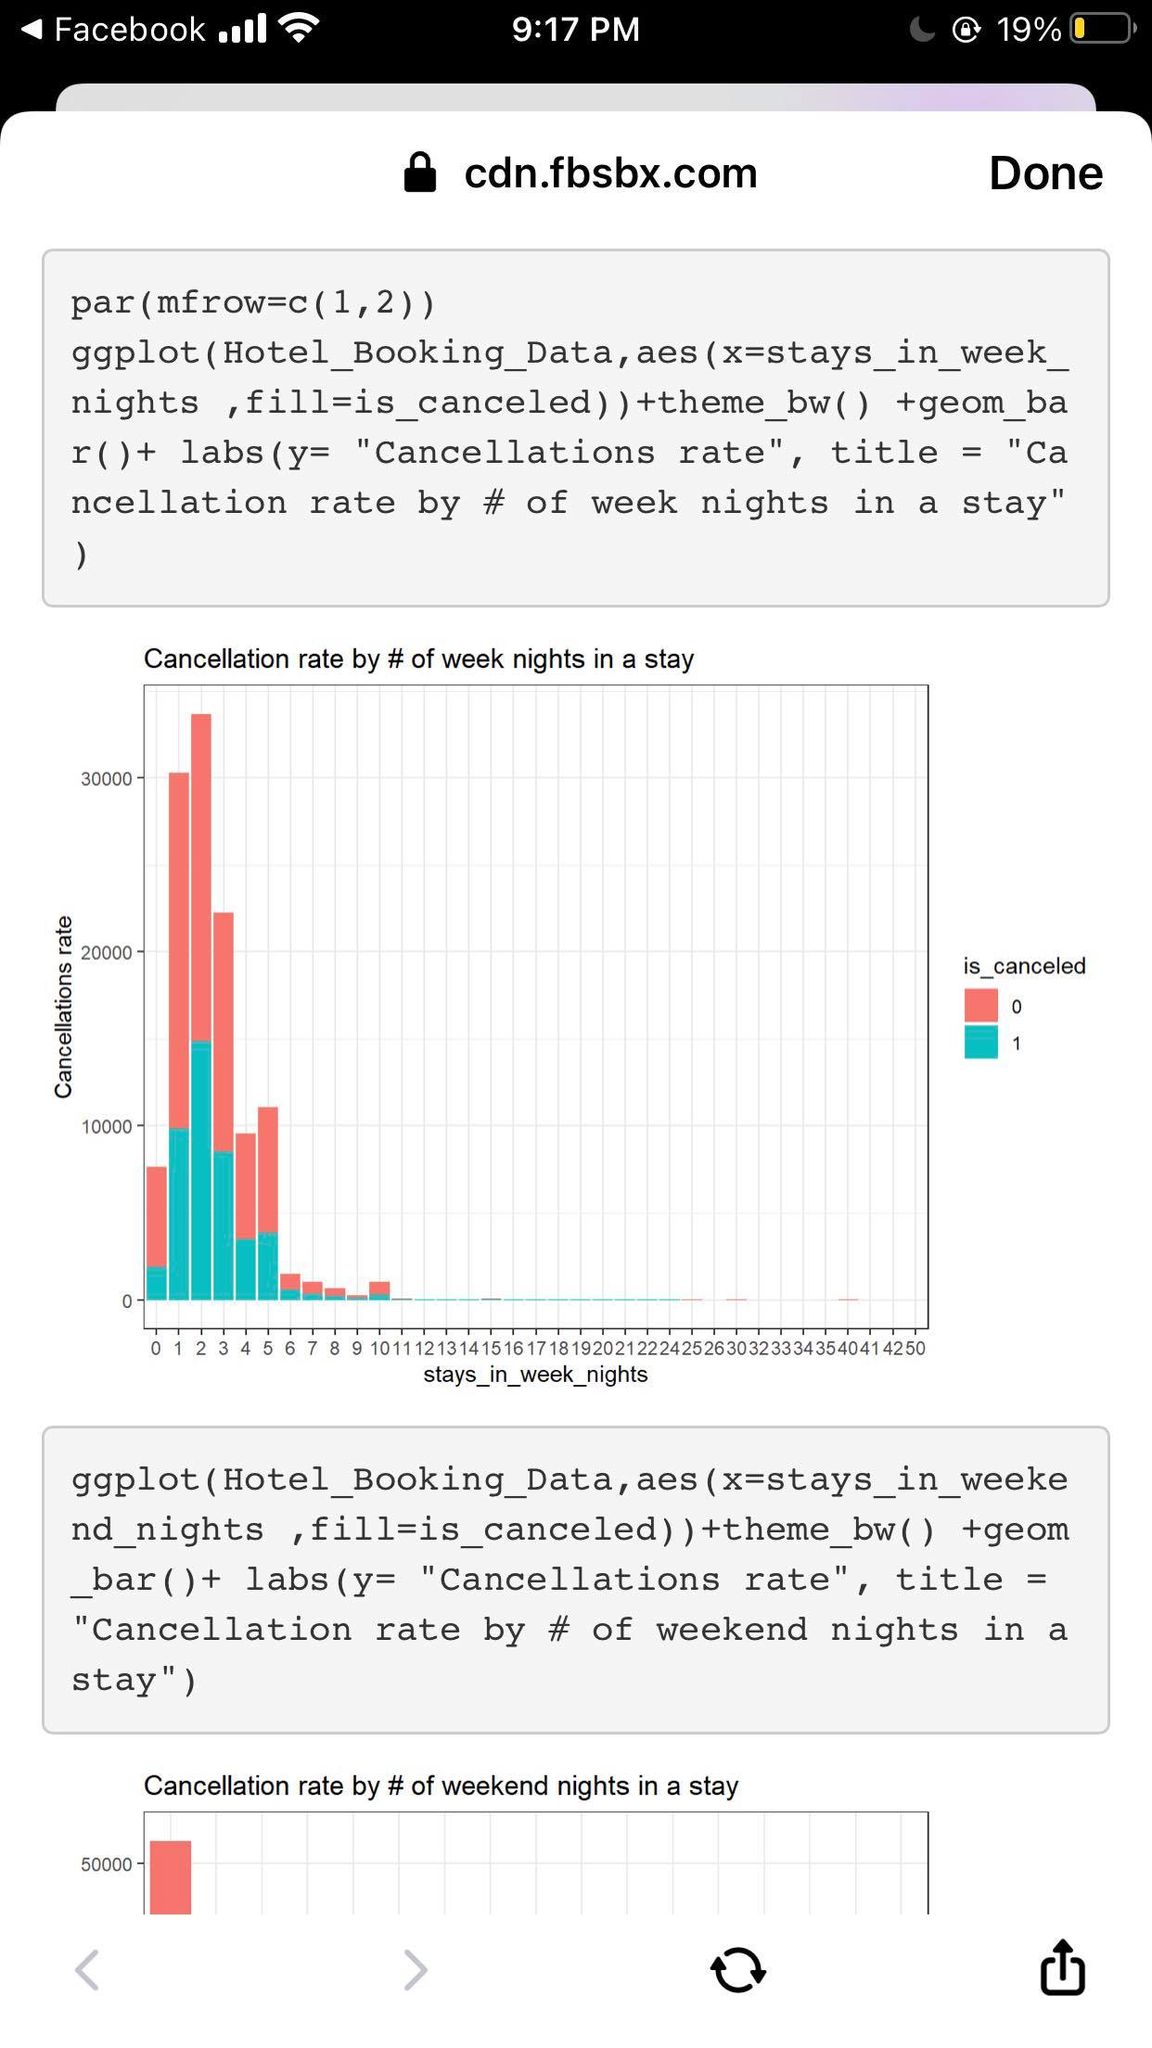
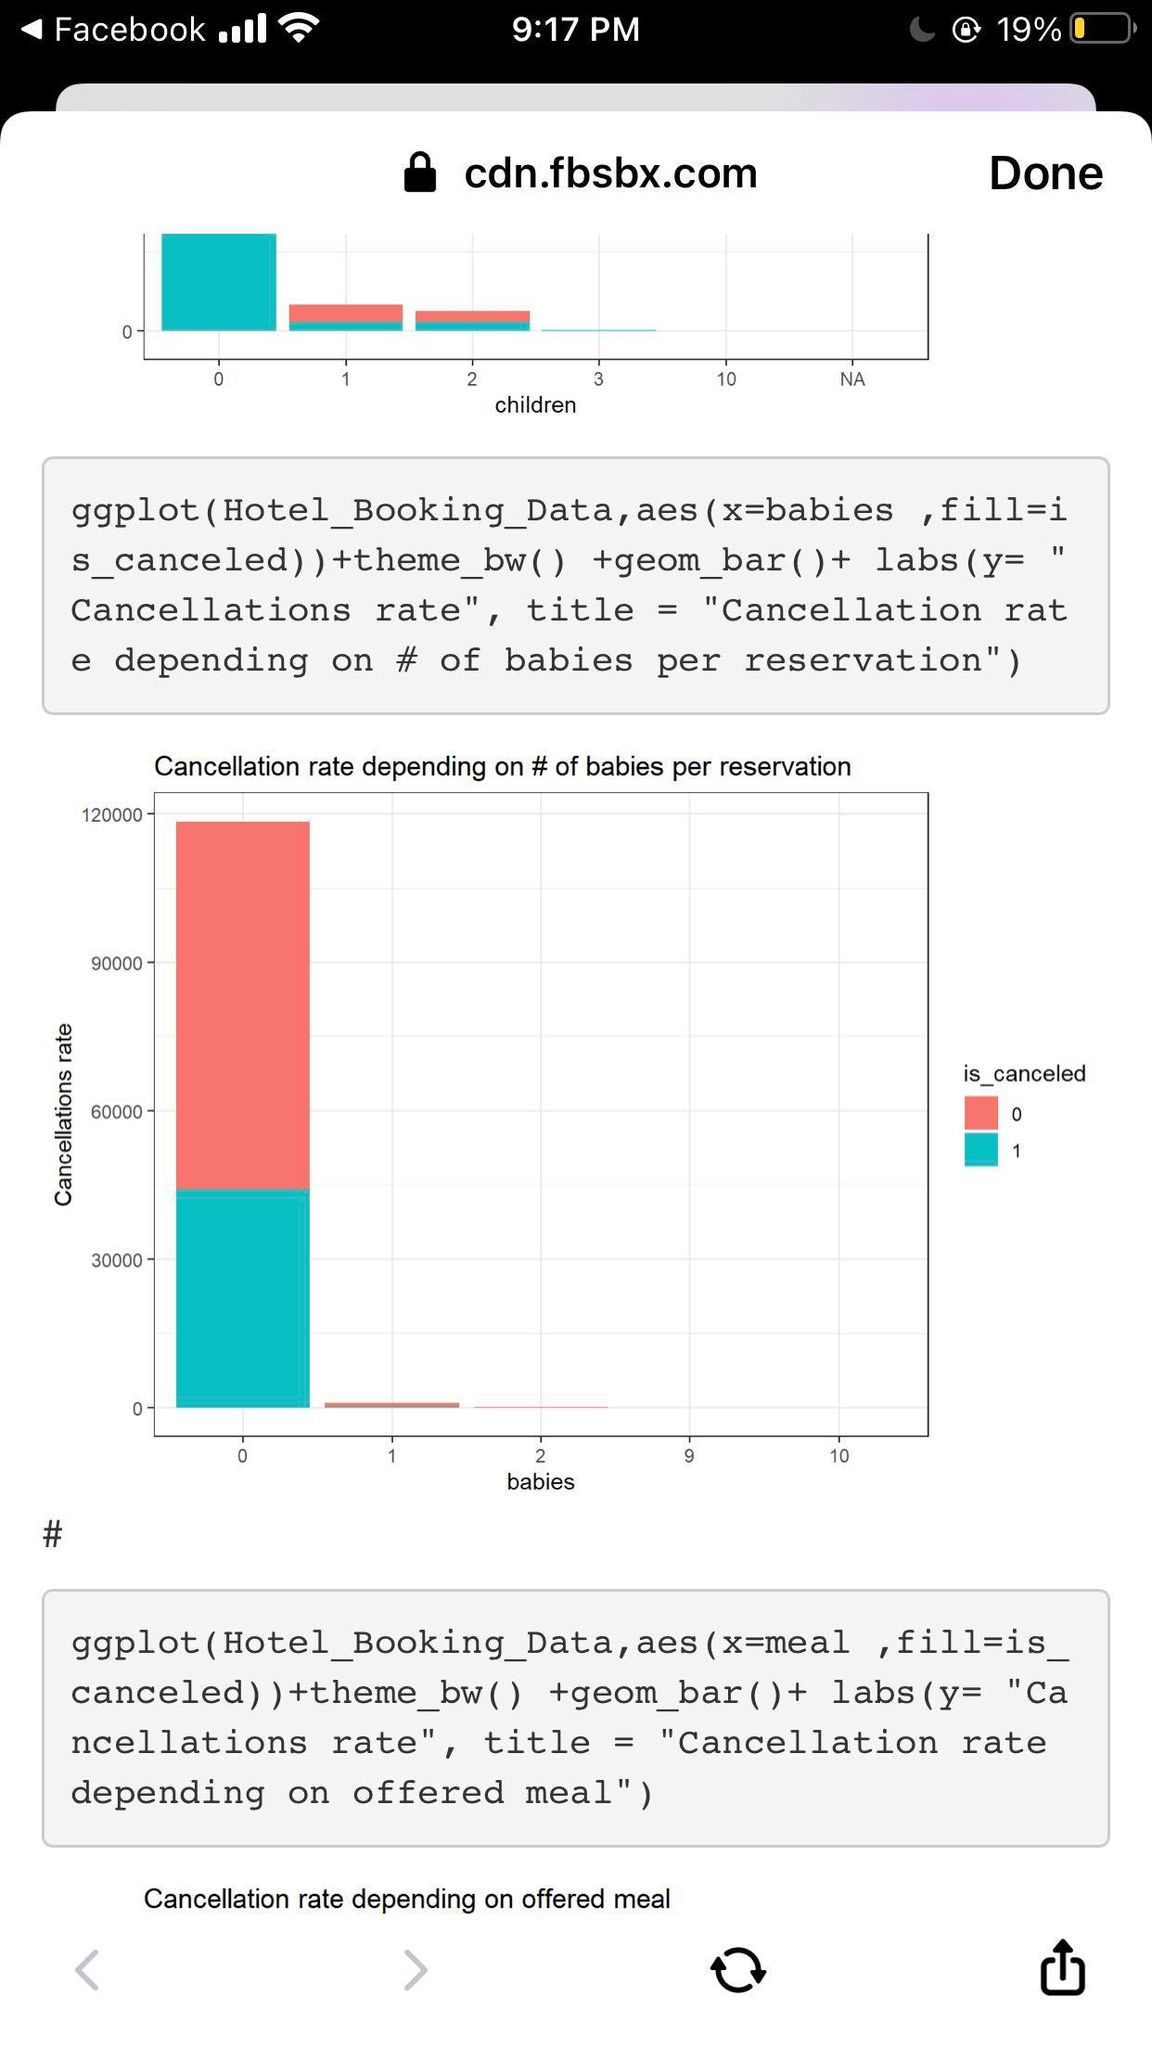
Facebook . ill - 9:17 PM C @ 19% cdn.fbsbx.com Done 2 5 6 10 20 26 27 40 50 55 adults ggplot (Hotel_Booking_Data, aes (x=children ,fill =is_canceled) ) +theme_bw( ) +geom_bar( )+ labs(y= "Cancellations rate", title = "Cancellation ra te depending on # of children per reservation" Cancellation rate depending on # of children per reservation 90000 - is canceled 60000 - Cancellations rate O 30000 - 0 - 10 NA children ggplot (Hotel_Booking_Data, aes (x=babies ,fill=i s_canceled) ) +theme_bw( ) +geom_bar( )+ labs(y= " Cancellations rate", title = "Cancellation rat e depending on # of babies per reservation") A QFacebook . ill - 9:17 PM C @ 19% cdn.fbsbx.com Done ggplot (Hotel_Booking_Data, aes (x=adults , fill=i s_canceled) ) +theme_bw( ) +geom_bar( )+ labs(y= " Cancellations rate", title = "Cancellation rat e depending on # of adults per reservation") Cancellation rate depending on # of adults per reservation 75000 - 50000 - is canceled Cancellations rate 25000 - 5 6 10 20 26 27 40 50 55 adults ggplot (Hotel_Booking_Data, aes (x=children , fill =is_canceled) ) +theme_bw( ) +geom_bar( )+ labs(y= "Cancellations rate", title = "Cancellation ra te depending on # of children per reservation" Cancellation rate depending on # of children per reservation 90000 -Facebook . ill - 9:17 PM C @ 19% cdn.fbsbx.com Done 0 - 0 1 2 3 4 5 6 7 8 9 1011 12 13 14 15 16 17 18 192021222425263032 33 343540414250 stays_in_week_nights ggplot (Hotel_Booking_Data, aes (x=stays_in_weeke nd_nights , fill=is_canceled) ) +theme_bw( ) +geom bar ( ) + labs (y= "Cancellations rate", title = "Cancellation rate by # of weekend nights in a stay" ) Cancellation rate by # of weekend nights in a stay 50000 - 40000 - 30000 - is canceled Cancellations rate 20000 - 10000 - 0 - 2 3 4 5 6 7 8 9 10 12 13 14 16 18 19 stays_in_weekend_nights # ggplot (Hotel_Booking_Data, aes (x=adults ,fill=i s_canceled) ) +theme_bw( ) +geom_bar( )+ labs (y= Cancellations rate", title = "Cancellation rat e depending on # of adults per reservation") Cancellation rate depending on # of adults per reservation AFacebook . ill - 9:17 PM C @ 19% cdn.fbsbx.com Done par (mfrow=c ( 1, 2) ) ggplot (Hotel_Booking_Data, aes (x=stays_in_week_ nights ,fill=is_canceled) ) +theme_bw( ) +geom_ba r( ) + labs (y= "Cancellations rate", title = "Ca ncellation rate by # of week nights in a stay" Cancellation rate by # of week nights in a stay 30000 - 20000 - is canceled Cancellations rate 10000 - 0 0 1 2 3 4 5 6 7 8 9 1011 12 13 14 15 16 17 18 19202122242526 303233 34354041 4250 stays_in_week_nights ggplot ( Hotel_Booking_Data, aes (x=stays_in_weeke nd_nights , fill=is_canceled) ) +theme_bw( ) +geom bar( )+ labs (y= "Cancellations rate", title = "Cancellation rate by # of weekend nights in a stay") Cancellation rate by # of weekend nights in a stay 50000Facebook . ill - 9:17 PM C @ 19% cdn.fbsbx.com Done 0 - City Hotel Resort Hotel hotel #F ggplot ( Hotel_Booking_Data, aes (x=country , fill= is_canceled) ) +theme_bw( ) +geom_bar ( )+ labs(y= "Cancellations rate", title = "Cancellation ra te by country guests came from" ) Cancellation rate by country guests came from 50000 - 40000 - 30000 - is canceled Cancellations rate 20000 - 10000 - O -. country ggplot ( Hotel_Booking_Data, aes (x=lead_time ,fil 1=is_canceled) ) +theme_bw( ) +geom_bar ( )+ labs(y = "Cancellations rate", title = "Cancellation rate depending on lead time") AFacebook . ill - 9:17 PM C @ 19% cdn.fbsbx.com Done # ggplot (Hotel_Booking_Data, aes (x=distribution_c hannel ,fill=is_canceled) ) +theme_bw( ) +geom_ba r( )+ labs (y= "Cancellations rate", title = "Ca ncellation rate depending on distribution chan nel" ) Cancellation rate depending on distribution channel 100000 - 75000 - is canceled Cancellations rate 50000 - 25000 - 0 - Corporate Direct GDS TA/TO Undefined distribution_channel # ggplot (Hotel_Booking_Data, aes (x=is_repeated_gu est , fill=is_canceled) ) +theme_bw( ) +geom_bar( ) + labs (y= "Cancellations rate", title = "Cance 1lation rate vs customer loyalty") Cancellation rate vs customer loyalty 120000 - AFacebook . ill 9:17 PM C @ 19% cdn.fbsbx.com Done 0 - BB FB HB SC Undefined meal # ggplot (Hotel_Booking_Data, aes (x=market_segment , fill=is_canceled) ) +theme_bw( ) +geom_bar( )+ la bs (y= "Cancellations rate", title = "Cancellat ion rate depending on market segment") Cancellation rate depending on market segment 40000 - is canceled Cancellations rate O 20000 - 0 - AviationComplementarCorporate Direct Groups Offline TA/TO Online TA Undefined market_segment # ggplot (Hotel_Booking_Data, aes (x=distribution_c hannel , fill=is_canceled) ) +theme_bw( ) +geom ba r( )+ labs (y= "Cancellations rate", title = "Ca ncellation rate depending on distribution chan nel" ) V AFacebook . ill 9:18 PM C @ 19% cdn.fbsbx.com Done 0 - A B C D E F G assigned_room_type # ggplot (Hotel_Booking_Data, aes (x=booking_change s ,fill=is_canceled) )+theme_bw( ) +geom_bar( )+ labs (y= "Cancellations rate", title = "Cancell ation rate depending on # of booking changes") Cancellation rate depending on # of booking changes 100000 75000 - is_canceled Cancellations rate 50000 - O 25000 - 0 2 3 5 6 7 8 9 10 11 12 13 14 15 16 17 18 20 21 booking_changes # ggplot (Hotel_Booking_Data, aes (x=deposit_type , fill=is_canceled) )+theme_bw( ) +geom_bar( )+ lab s (y= "Cancellations rate", title = "Cancellati on rate depending on deposit type")Facebook . ill - 9:17 PM C @ 19% cdn.fbsbx.com Done Cancellation 20000 - 10000 - country ggplot (Hotel_Booking_Data, aes (x=lead_time ,fil 1=is_canceled) ) +theme_bw( ) +geom_bar( )+ labs(y = "Cancellations rate", title = "Cancellation rate depending on lead time") Cancellation rate depending on lead time 6000 - 4000 is canceled Cancellations rate 0 2000 - 0 lead_time par (mfrow=c( 1, 2) ) wantAt /Untal Donking Data andlyontown in talFacebook . ill - 9:17 PM C @ 19% cdn.fbsbx.com Done 0 - N - 10 NA children ggplot (Hotel_Booking_Data, aes (x=babies ,fill=i s_canceled) ) +theme_bw( ) +geom_bar( )+ labs (y= " Cancellations rate", title = "Cancellation rat e depending on # of babies per reservation") Cancellation rate depending on # of babies per reservation 120000 - 90000 - is_canceled Cancellations rate 60000 - 30000 - 0 - 0 2 10 babies # ggplot (Hotel_Booking_Data, aes (x=meal ,fill=is_ canceled) ) +theme_bw( ) +geom_bar( )+ labs(y= "Ca ncellations rate", title = "Cancellation rate depending on offered meal") Cancellation rate depending on offered meal AFacebook . ill - 9:17 PM C @ 19% cdn.fbsbx.com Done ggplot (Hotel_Booking_Data, aes (x=hotel , fill=is canceled) ) +theme_bw( ) +geom_bar( ) + labs(y= "C ancellations rate", title = "Cancellation rate by hotel" ) Cancellation rate by hotel 80000 - 60000 - is canceled Cancellations rate 40000 - 0 20000 - 0 - City Hotel Resort Hotel hotel # ggplot (Hotel_Booking_Data, aes (x=country , fill= is_canceled) ) +theme_bw( ) +geom_bar ( )+ labs(y= "Cancellations rate", title = "Cancellation ra te by country guests came from") Cancellation rate by country guests came from 50000 - 40000 -Facebook . ill - 9:17 PM C @ 19% cdn.fbsbx.com Done 2 10 babies # ggplot ( Hotel_Booking_Data, aes (x=meal , fill=is_ canceled) ) +theme_bw( ) +geom_bar( )+ labs(y= "Ca ncellations rate", title = "Cancellation rate depending on offered meal") Cancellation rate depending on offered meal 75000- is_canceled 50000 - Cancellations rate 25000 - BB FB HB SC Undefined meal # ggplot (Hotel_Booking_Data, aes (x=market_segment , fill=is_canceled) ) +theme_bw( ) +geom_bar( )+ la bs (y= "Cancellations rate", title = "Cancellat ion rate depending on market segment")Facebook . ill - 9:17 PM C @ 19% cdn.fbsbx.com Done Corporate Direct GUS IAIU UnaeTinea distribution_channel # ggplot ( Hotel_Booking_Data, aes (x=is_repeated_gu est , fill=is_canceled) ) +theme_bw( ) +geom_bar( ) + labs (y= "Cancellations rate", title = "Cance 1lation rate vs customer loyalty") Cancellation rate vs customer loyalty 120000 - 90000 - is canceled 60000 - Cancellations rate 30000 0 is_repeated_guest # ggplot ( Hotel_Booking_Data, aes (x=previous_cance llations ,fill=is_canceled) )+theme_bw( ) +geom bar( )+ labs (y= "Cancellations rate", title = " Cancellation rate vs previous cancellations") Cancellation rate vs previous cancellationsFacebook . ill - 9:17 PM C @ 19% cdn.fbsbx.com Done as . factor (Hotel_Booking_Data$total_of_special requests ) #Cancelled vs not cancelled: ggplot ( Hotel_Booking_Data, aes (x=is_canceled) )+ theme_bw( ) +geom_bar( )+ labs (y= "Cancellations rate", title = "Cancellation rate for hotel bo okings" ) Cancellation rate for hotel bookings 60000 - 40000 - Cancellations rate 20000 - 0 - is_canceled ggplot (Hotel_Booking_Data, aes (x=hotel , fill=is _canceled) ) +theme_bw( ) +geom_bar( )+ labs(y= "C ancellations rate", title = "Cancellation rate by hotel" ) Cancellation rate bv hotel
Step by Step Solution
There are 3 Steps involved in it

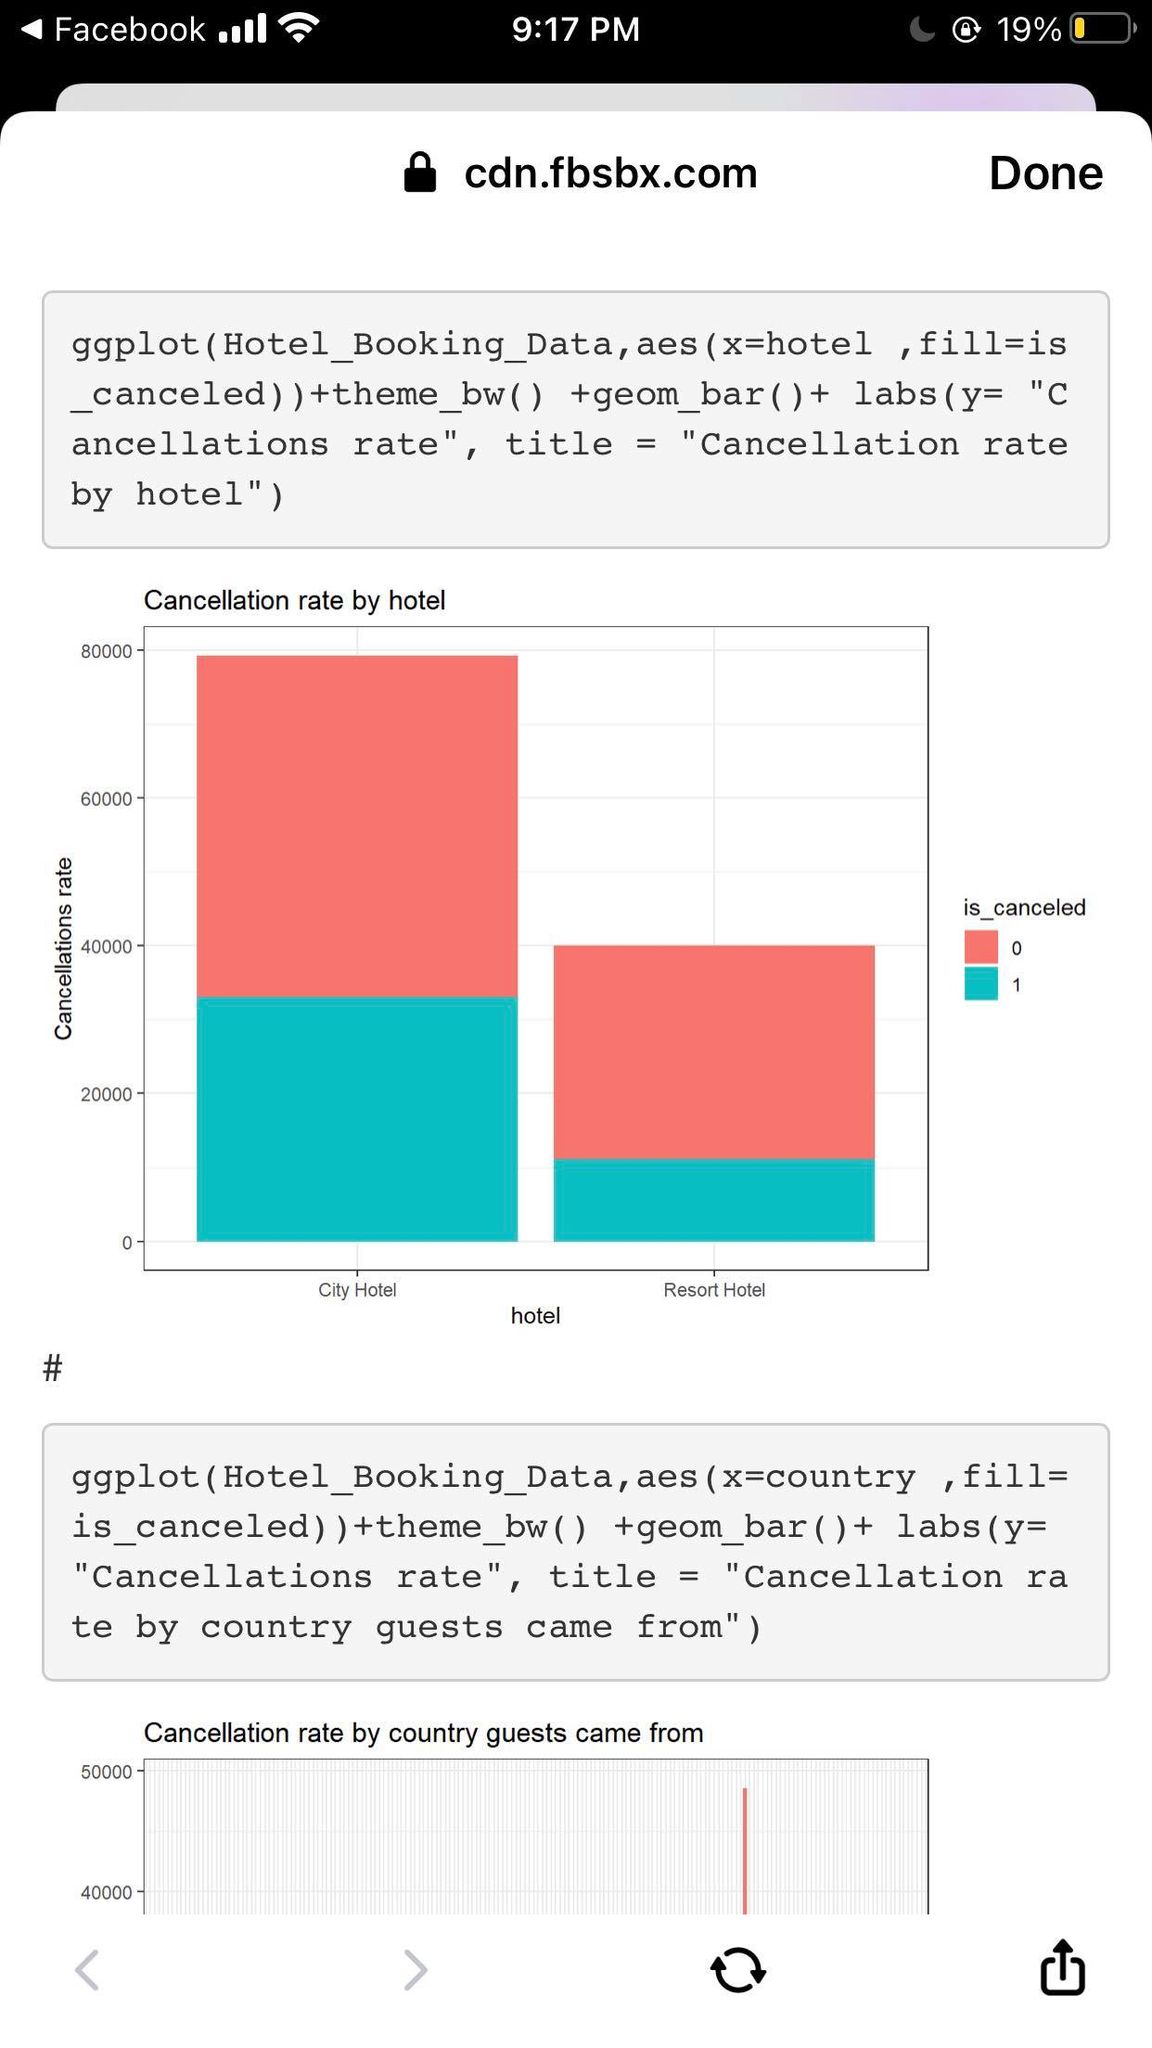
Get step-by-step solutions from verified subject matter experts