

Question: How can I get these two scatterplots on the same screen using the grid.arrange function? This is in R. Please help. Thank you ( begin{array}{l}operatorname{labs}(x=text
How can I get these two scatterplots on the same screen using the grid.arrange function? This is in R. Please help. Thank you
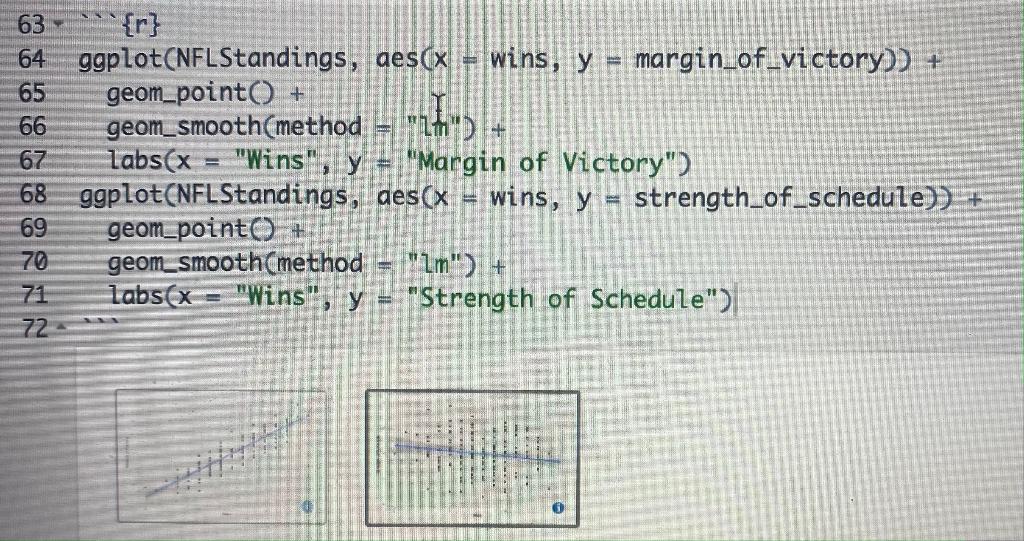
\( \begin{array}{l}\operatorname{labs}(x=\text { "Wins", } y=\text { "Margin of Victory") } \\ 68 \text { ggplot(NFLStandings, } \alpha e s(x=\text { wins, } y=\text { strength_of_schedule) })+ \\ \text { geom_point() + } \\ \text { geom_smooth (method }=\text { " } 2 \mathrm{~m} ")+ \\ \operatorname{tabs}(x=\text { "Wins", } y=\text { "Strength of ScheduZe") } \\\end{array} \)
Step by Step Solution
There are 3 Steps involved in it
1 Expert Approved Answer
Step: 1 Unlock

Question Has Been Solved by an Expert!
Get step-by-step solutions from verified subject matter experts
Step: 2 Unlock
Step: 3 Unlock