

Question: How can I put this in an Excel report? Below is the information for the question Notice that the Average Medicare Payment in Toledo is
How can I put this in an Excel report?
Below is the information for the question
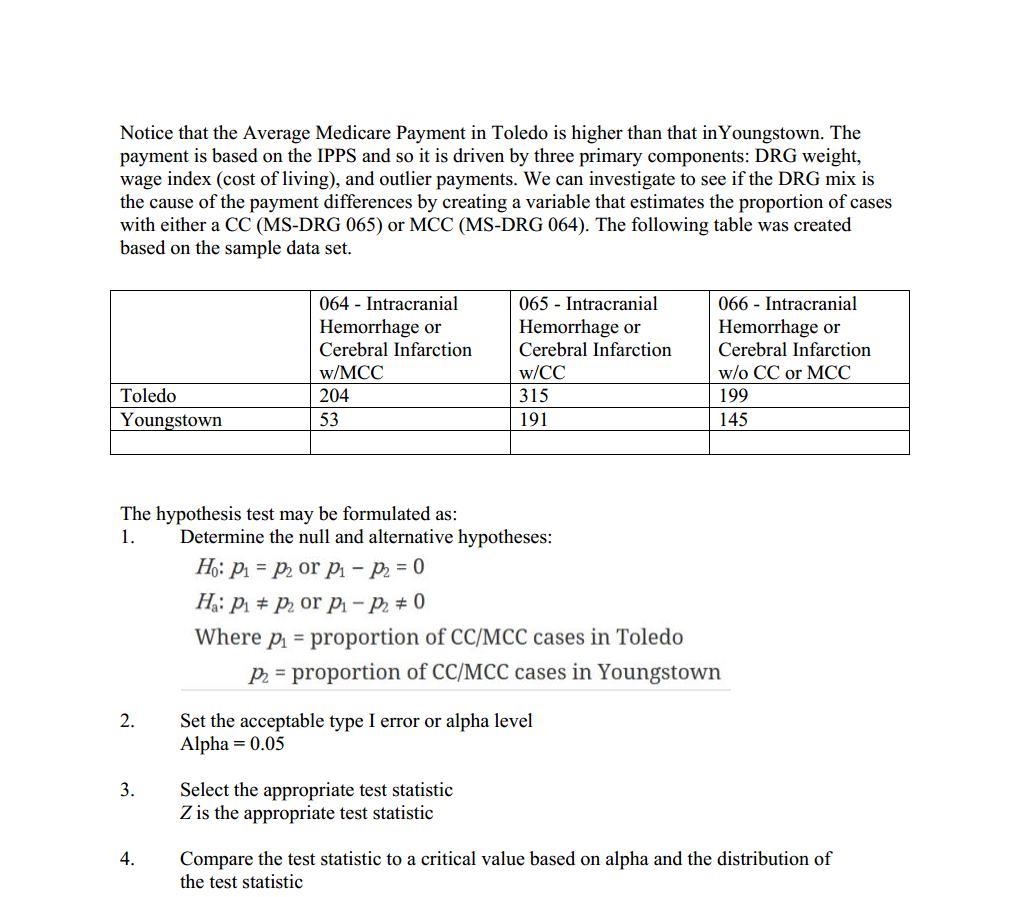
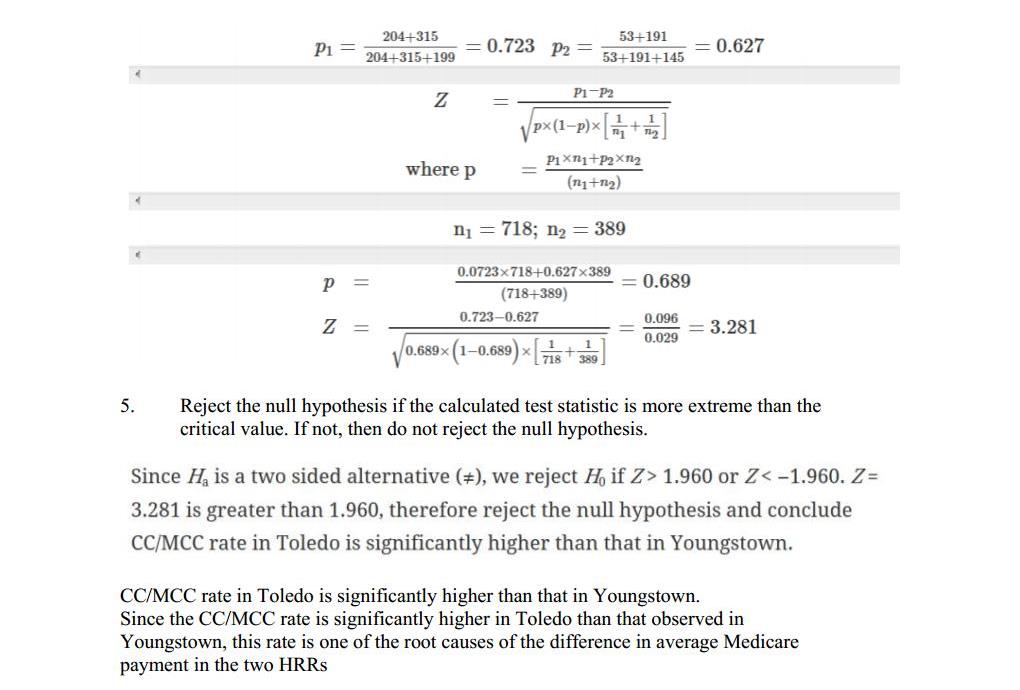
Notice that the Average Medicare Payment in Toledo is higher than that in Youngstown. The payment is based on the IPPS and so it is driven by three primary components: DRG weight, wage index (cost of living), and outlier payments. We can investigate to see if the DRG mix is the cause of the payment differences by creating a variable that estimates the proportion of cases with either a CC (MS-DRG 065) or MCC (MS-DRG 064). The following table was created based on the sample data set. 064 - Intracranial 065 - Intracranial 066 - Intracranial Hemorrhage or Hemorrhage or Hemorrhage or Cerebral Infarction Cerebral Infarction Cerebral Infarction w/MCC w/CC w/o CC or MCC Toledo 204 315 199 Youngstown 53 191 145 The hypothesis test may be formulated as: 1. Determine the null and alternative hypotheses: Ho: Pi = Pz or pi - P2 = 0 Ha: Pi # P or pi - P. # 0 Where pi = proportion of CC/MCC cases in Toledo P = proportion of CC/MCC cases in Youngstown 2. Set the acceptable type I error or alpha level Alpha = 0.05 3. Select the appropriate test statistic Z is the appropriate test statistic 4. Compare the test statistic to a critical value based on alpha and the distribution of the test statisticP1 = 204+315 = 0.723 P2 = 53+191 204+315+199 53+191+145 = 0.627 Z PI P2 Vpx(1-p)x m+ m where p Pixn1+p2Xn2 (n1+2) n1 = 718; n2 = 389 P 0.0723x718+0.627x389 (718+389) 0.689 Z = 0.723-0.627 0.096 = 3.281 0.689x 1-0.689 x 718 + 389 0.029 5. Reject the null hypothesis if the calculated test statistic is more extreme than the critical value. If not, then do not reject the null hypothesis. Since Ha is a two sided alternative (#), we reject H, if Z> 1.960 or Z
Step by Step Solution
There are 3 Steps involved in it

Get step-by-step solutions from verified subject matter experts