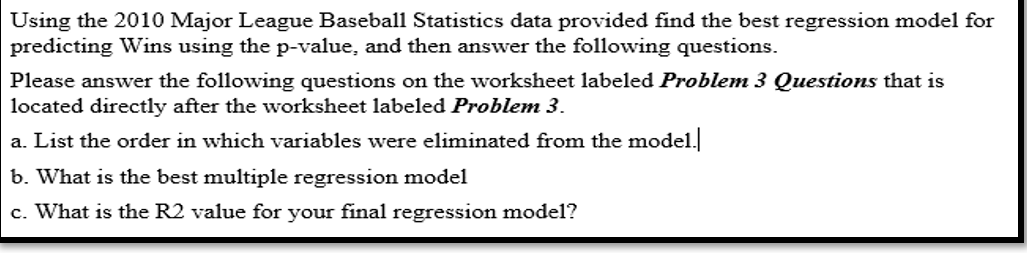
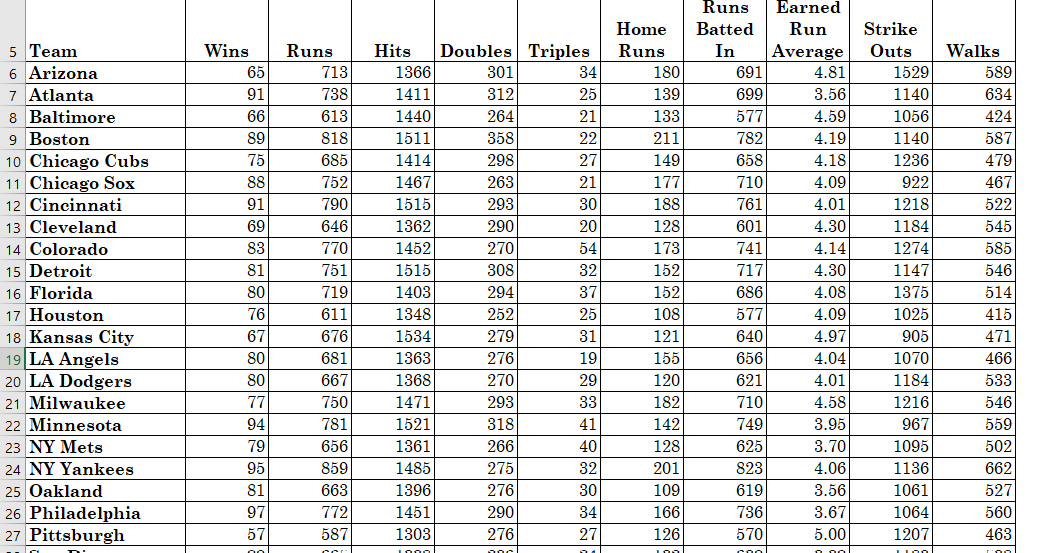
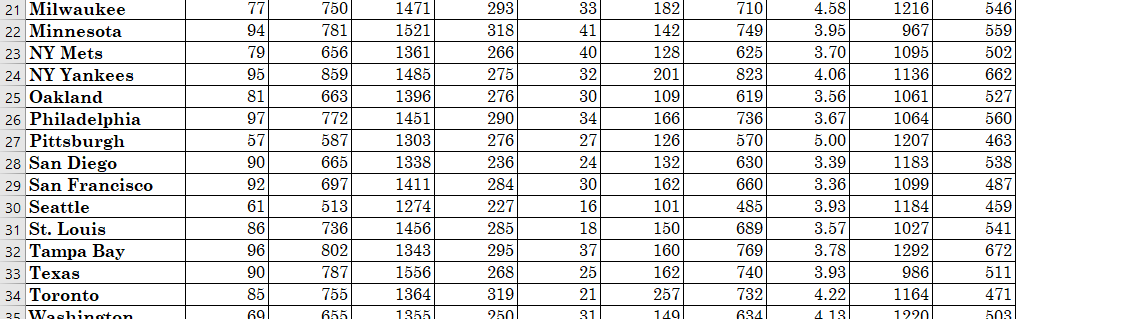
Question: How can I solve this in excel? Using the 2010 Major League Baseball Statistics data provided find the best regression model for predicting Wins using

How can I solve this in excel?

How can I solve this in excel? Using the 2010How can I solve this in excel? Using the 2010How can I solve this in excel? Using the 2010

Using the 2010 Major League Baseball Statistics data provided find the best regression model for predicting Wins using the p-value, and then answer the following questions. Please answer the following questions on the worksheet labeled Problem 3 Questions that is located directly after the worksheet labeled Problem 3. a. List the order in which variables were eliminated from the model./ b. What is the best multiple regression model c. What is the R2 value for your final regression model? Walks 589 634 424 587 479 5 Team 6 Arizona 7 Atlanta 8 Baltimore 9 Boston 10 Chicago Cubs 11 Chicago Sox 12 Cincinnati 13 Cleveland 14 Colorado 15 Detroit 16 Florida 17 Houston 18 Kansas City 19 LA Angels 20 LA Dodgers 21 Milwaukee 22 Minnesota 23 NY Mets 24 NY Yankees 25 Oakland 26 Philadelphia 27 Pittsburgh Wins 65 91 66 89 75 88 91 69 83 81 80 76 67 80 80 77 94 79 95 81 97 57 no Runs 713 738 613 818 685 752 790 646 770 751 719 611 676 681 667 750 781 656 859 663) 772 587 Hits Doubles Triples 1366 301 34 1411 312 25 1440 264 21 1511 358 22 1414 298 27 1467 263 21 1515 293 30 1362 290 20 1452 270 54 1515 308 32 1403 294 37 1348 252 25 1534 279 31 1363 276 19 1368 270 29 1471 293 33 1521 318 41 1361 266 40 1485 275 32 1396 276 30 1451 290 34 1303) 276 27 Innol Home Runs 180 139 133 211 149 177 188 128 173 152 152 108 121 155 120 182 142 128 201 109 166 126 Runs Earned Batted Run In Average 691 4.81 699 3.56 577 4.59 782 4.19 658 4.18 710 4.09 761 4.01 601 4.30 741 4.14 717 4.30 686 4.08 577 4.09 640 4.97 656 4.04 621 4.01 710 4.58 749 3.95 625 3.70 823 4.06 619 3.56 736 3.67 5701 5.00 cool Strike Outs 1529 1140 1056 1140 1236 922 1218 1184 1274 1147 1375 1025 905 1070 1184 1216 967 1095 1136 1061 1064 1207 467 522 545 585 546 514 415 471 466 533 546 559 502 662 527 560 463 na 546 21 Milwaukee 22 Minnesota 23 NY Mets 24 NY Yankees 25 Oakland 26 Philadelphia 27 Pittsburgh 28 San Diego 29 San Francisco 30 Seattle 31 St. Louis 32 Tampa Bay 33 Texas 34 Toronto 25 Washington 77 94 79 95 81 97 57 90 92 61 86 96 90 85 750 781 656 859 663 772 587 665 697 513 736 802 787 755 655 1471 1521 1361 1485 1396 1451 1303 1338 1411 1274 1456 1343 1556 1364 13551 293 318 266 275 276 290 276 236 284 227 285 295 268 319 250 33 41 40 32 30 34 27 24 30 16 18 37 25 21 182 142 128 201 109 166 126 132 162 101 150 160 162 257 149 710 749 625 823 619 736 570 630 660 485 689 769 740 732 6341 4.58 3.95 3.70 4.06 3.56 3.67 5.00 3.39 3.36 3.93 3.57 3.78 3.93 4.22 4 13 1216 967 1095 1136 1061 1064 1207 1183 1099 1184 1027 1292 986 1164 1220 559 502 662 527 560 463 538 487 459 541 672 511 471 503 69 31

Step by Step Solution

There are 3 Steps involved in it

1 Expert Approved Answer
Step: 1 Unlock blur-text-image
Question Has Been Solved by an Expert!

Get step-by-step solutions from verified subject matter experts

Step: 2 Unlock
Step: 3 Unlock

Students Have Also Explored These Related General Management Questions!