

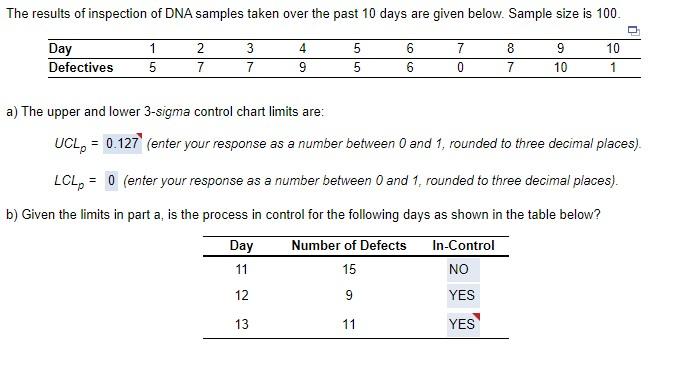
Question: How can I solve this via excel formulas? a) The upper and lower 3-sigma control chart limits are: UCLp=0.127 (enter your response as a number
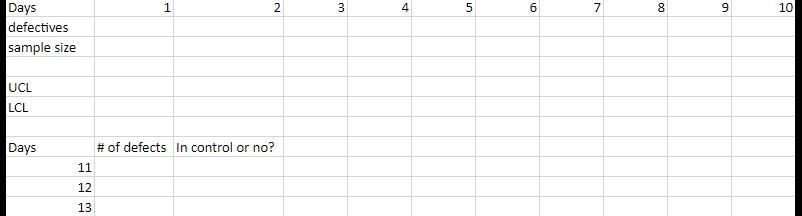
How can I solve this via excel formulas?
Step by Step Solution
There are 3 Steps involved in it
1 Expert Approved Answer
Step: 1 Unlock

Question Has Been Solved by an Expert!
Get step-by-step solutions from verified subject matter experts
Step: 2 Unlock
Step: 3 Unlock