

Question: How can i use this data in a box plot to diffrentiate which gender consists of better drivers? DATA A sample of data from the
How can i use this data in a box plot to diffrentiate which gender consists of better drivers?
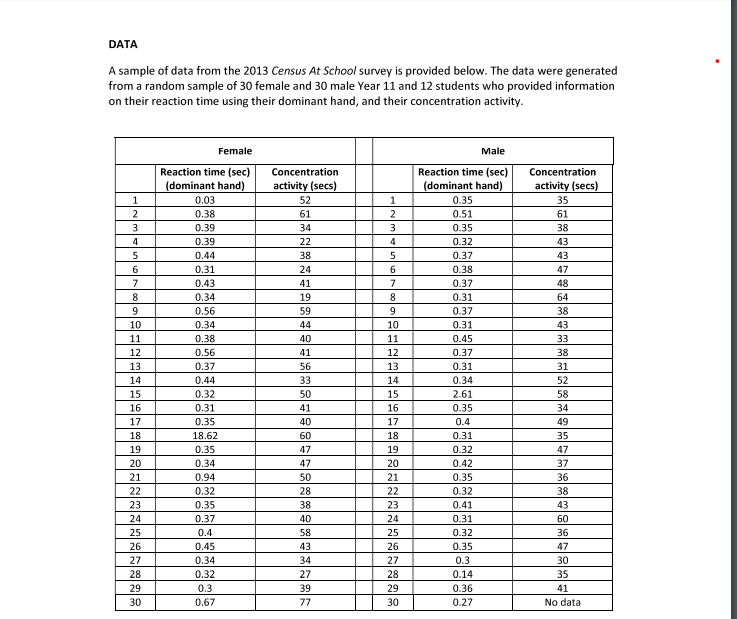
DATA A sample of data from the 2013 Census At School survey is provided below. The data were generated from a random sample of 30 female and 30 male Year 11 and 12 students who provided information on their reaction time using their dominant hand, and their concentration activity. Female Male Reaction time (sec Concentration Reaction time (sec) Concentration (dominant hand) activity (secs) (dominant hand) activity (secs) 1 0.03 52 0.35 35 2 1.38 w 61 0.51 61 0.39 34 0.35 38 4 0.39 22 D.32 43 0.44 38 0.37 43 0.31 24 0.38 47 0.43 41 0.37 48 0.34 19 0.31 64 9 0.56 59 0.37 38 10 0.34 44 0.31 43 11 J.38 40 11 0.45 33 12 1.5 41 12 0.37 38 13 0.37 56 13 0.31 31 14 0.44 33 14 0.34 52 15 0.32 50 15 2.61 58 16 0.31 41 16 0.35 34 17 0.35 40 17 0.4 49 18 18.62 60 18 0.31 35 19 0.35 47 19 0.32 47 20 0.34 47 20 0.42 37 21 0.94 50 21 1.35 36 22 0.32 28 22 0.32 38 23 0.35 38 23 0.41 43 24 0.37 40 24 D.31 60 25 D.4 58 25 0.32 36 26 0.45 43 26 0.35 47 27 0.34 34 27 0.3 30 28 0.32 27 28 0.14 35 20 0.3 39 29 0.36 41 30 0.67 77 30 0.27 No data
Step by Step Solution
There are 3 Steps involved in it

Get step-by-step solutions from verified subject matter experts