

Question: How can Power BI provide more powerful and compelling visualizations than Excel? Power BI can use Pivot Charts. Power BI can create an interactive dashboard.
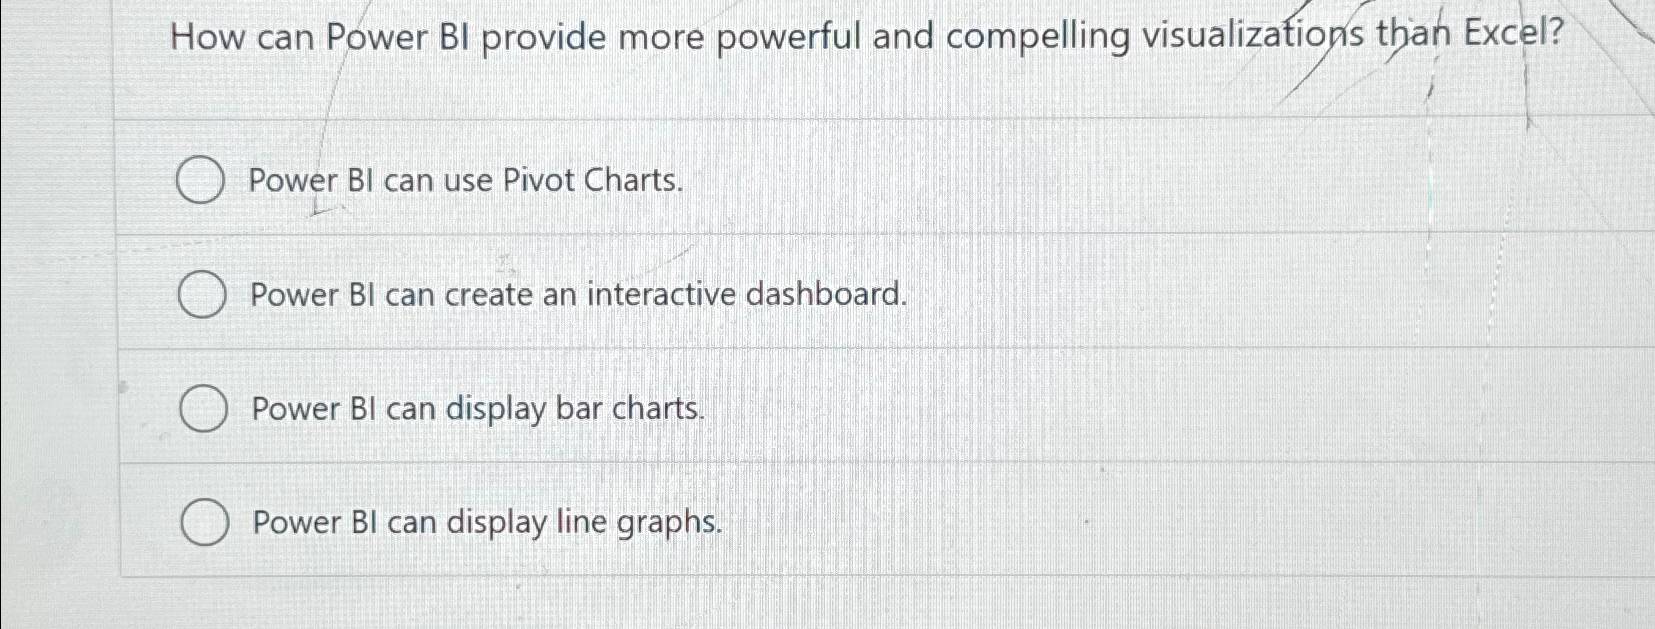
How can Power BI provide more powerful and compelling visualizations than Excel?
Power BI can use Pivot Charts.
Power BI can create an interactive dashboard.
Power BI can display bar charts.
Power BI can display line graphs.
Step by Step Solution
There are 3 Steps involved in it
1 Expert Approved Answer
Step: 1 Unlock

Question Has Been Solved by an Expert!
Get step-by-step solutions from verified subject matter experts
Step: 2 Unlock
Step: 3 Unlock