

Question: How compensation (base pay, performance pay and indirect pay) vary along various managerial strategies such as high involvement, human relations and classical. What is the
How compensation (base pay, performance pay and indirect pay) vary along various managerial strategies such as high involvement, human relations and classical.
What is the amount of base, performance and indirect pay you would use for the 10 Industrial Engineers in this organization if it were practicing a high involvement management strategy?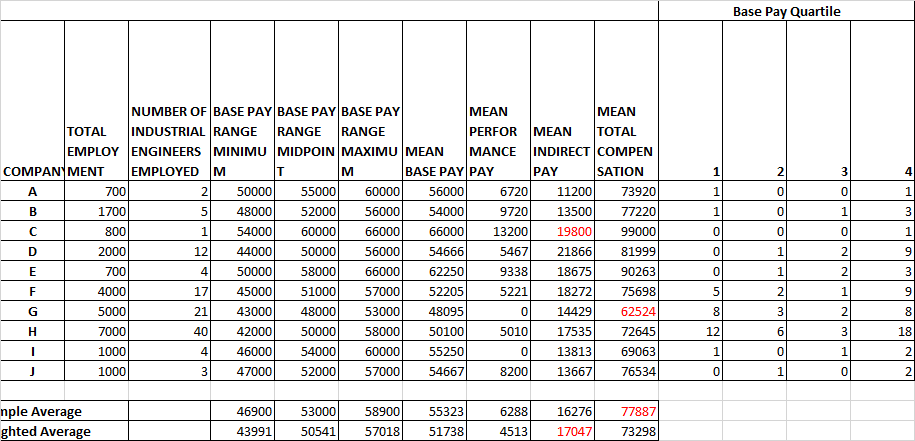
Base Pay Quartile 1 2 3 4 1 0 0 1 1 0 1 3 0 0 0 1 NUMBER OF BASE PAY BASE PAY BASE PAY MEAN MEAN TOTAL INDUSTRIAL RANGE RANGE RANGE PERFOR MEAN TOTAL EMPLOY ENGINEERS MINIMU MIDPOIN MAXIMU MEAN MANCE INDIRECT COMPEN COMPAN MENT EMPLOYED M T M BASE PAY PAY PAY SATION 700 2 50000 55000 60000 56000 6720 11200 73920 B 1700 5 48000 52000 56000 54000 9720 13500 77220 C 800 1 54000 60000 66000 66000 13200 19800 99000 D 2000 12 44000 50000 56000 54666 5467 21866 81999 E 700 4 50000 58000 66000 62250 9338 18675 90263 F 4000 17 45000 51000 57000 52205 5221 18272 75698 G 5000 21 43000 48000 53000 48095 0 14429 62524 H 7000 40 42000 50000 58000 50100 5010 17535 72645 1 1000 4 46000 54000 60000 55250 0 13813 69063 J 1000 3 47000 52000 57000 54667 8200 13667 76534 0 1 2 9 0 1 2 5 2 1 co 3 2 NN o Cow 12 6 3 18 1 0 1 0 1 0 46900 53000 58900 55323 16276 77887 nple Average ghted Average 6288 4513 43991 50541 57018 51738 17047 73298 Base Pay Quartile 1 2 3 4 1 0 0 1 1 0 1 3 0 0 0 1 NUMBER OF BASE PAY BASE PAY BASE PAY MEAN MEAN TOTAL INDUSTRIAL RANGE RANGE RANGE PERFOR MEAN TOTAL EMPLOY ENGINEERS MINIMU MIDPOIN MAXIMU MEAN MANCE INDIRECT COMPEN COMPAN MENT EMPLOYED M T M BASE PAY PAY PAY SATION 700 2 50000 55000 60000 56000 6720 11200 73920 B 1700 5 48000 52000 56000 54000 9720 13500 77220 C 800 1 54000 60000 66000 66000 13200 19800 99000 D 2000 12 44000 50000 56000 54666 5467 21866 81999 E 700 4 50000 58000 66000 62250 9338 18675 90263 F 4000 17 45000 51000 57000 52205 5221 18272 75698 G 5000 21 43000 48000 53000 48095 0 14429 62524 H 7000 40 42000 50000 58000 50100 5010 17535 72645 1 1000 4 46000 54000 60000 55250 0 13813 69063 J 1000 3 47000 52000 57000 54667 8200 13667 76534 0 1 2 9 0 1 2 5 2 1 co 3 2 NN o Cow 12 6 3 18 1 0 1 0 1 0 46900 53000 58900 55323 16276 77887 nple Average ghted Average 6288 4513 43991 50541 57018 51738 17047 73298
Step by Step Solution
There are 3 Steps involved in it

Get step-by-step solutions from verified subject matter experts