

Question: How did Coca Cola's cash flows from operating activities compare with its net income? What are the major reasons for the differences? How did Coca
How did Coca Cola's cash flows from operating activities compare with its net income? What are the major reasons for the differences?
How did Coca Cola's cash flow from investing activities compare with its cash flow from operating activities? What does this comparison suggest about Coca Cola's growth?
What are the major items in the financing section of Coca Cola's statement of cash flows? How do Coca Cola's financing cash flows relate to the company's growth?
Are Coca Cola's cash flows consistent with those of a mature company? Explain
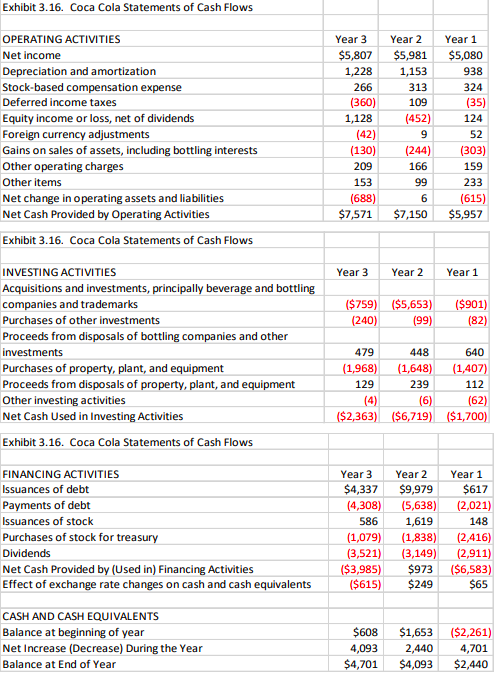
Exhibit 3.16. Coca Cola Statements of Cash Flows OPERATING ACTIVITIES Net income Depreciation and amortization Stock-based compensation expense Deferred income taxes Equity income or loss, net of dividends Foreign currency adjustments Gains on sales of assets, including bottling interests Other operating charges Other items Net change in operating assets and liabilities Net Cash Provided by Operating Activities Exhibit 3.16. Coca Cola Statements of Cash Flows Year 3 $5,807 1,228 266 (360) 1,128 (42) (130) 209 153 (688) $7,571 Year 2 $5,981 1,153 313 109 (452) 9 (244) 166 99 Year 1 $5,080 938 324 (35) 124 52 (303) 159 233 (615) $5,957 6 $7,150 Year 3 Year 2 Year 1 ($759) ($5,653) (240) (99) ($901) (82) INVESTING ACTIVITIES Acquisitions and investments, principally beverage and bottling companies and trademarks Purchases of other investments Proceeds from disposals of bottling companies and other investments Purchases of property, plant, and equipment Proceeds from disposals of property, plant, and equipment Other investing activities Net Cash Used in Investing Activities Exhibit 3.16. Coca Cola Statements of Cash Flows 479 448 640 (1,968) (1,648) (1,407) 129 239 112 (4) (6) (62) ($2,363) ($6,719) ($1,700) FINANCING ACTIVITIES Issuances of debt Payments of debt Issuances of stock Purchases of stock for treasury Dividends Net Cash Provided by (Used in) Financing Activities Effect of exchange rate changes on cash and cash equivalents Year 3 $4,337 (4,308) 586 (1,079) (3,521) ($3,985) ($615) Year 2 $9,979 (5,638) 1,619 (1,838) (3,149) $973 $249 Year 1 $617 (2,021) 148 (2,416) (2,911) ($6,583) $65 CASH AND CASH EQUIVALENTS Balance at beginning of year Net Increase (Decrease) During the Year Balance at End of Year $608 4,093 $4,701 $1,653 ($2,261) 2,440 4,701 $4,093 $2,440
Step by Step Solution
There are 3 Steps involved in it

Get step-by-step solutions from verified subject matter experts