

Question: how did we get the yellow highlighted numbers. explain please. this has been my third time posting this question!!! Thank you! 119.93 119.09 30.02 24.75
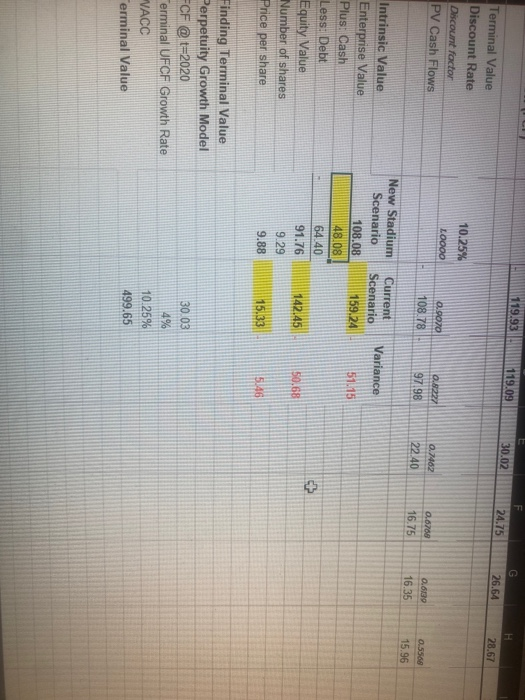
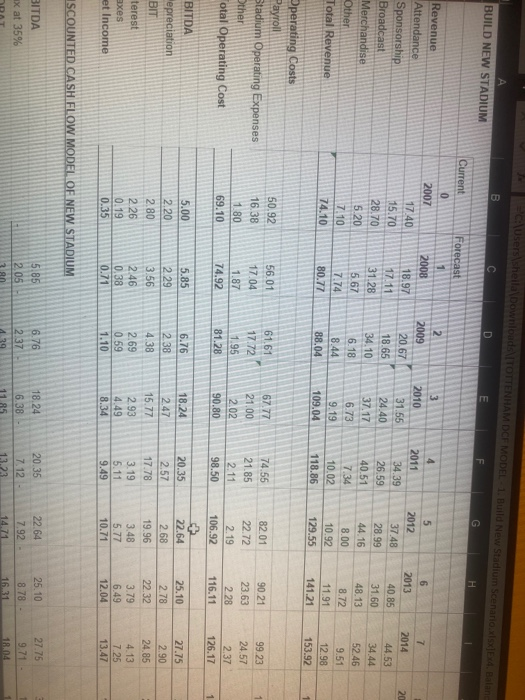
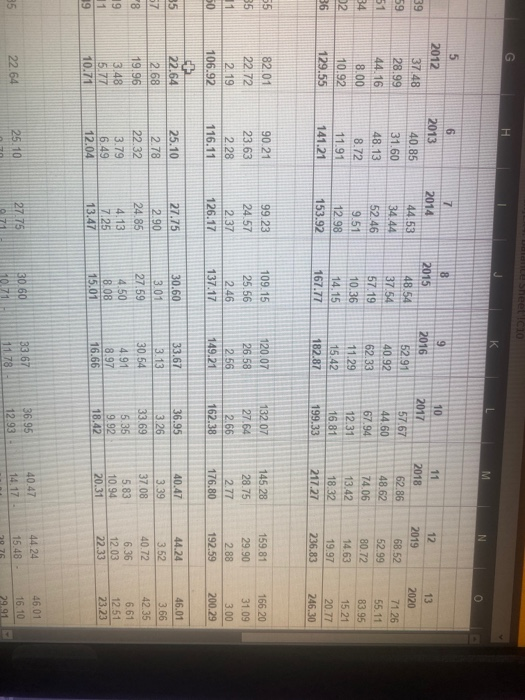
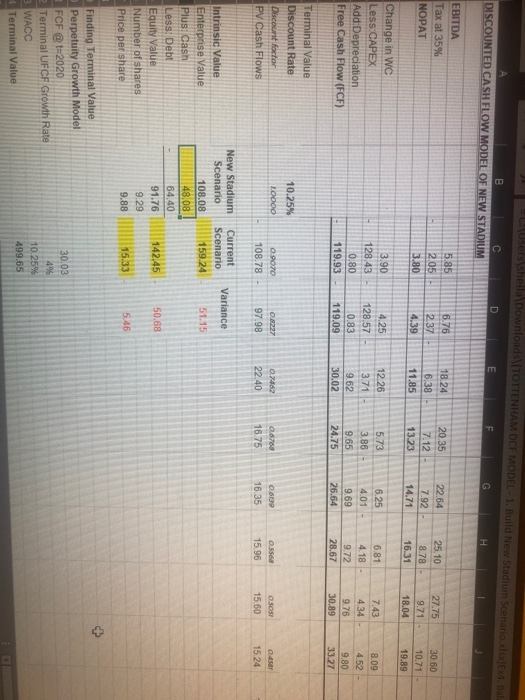
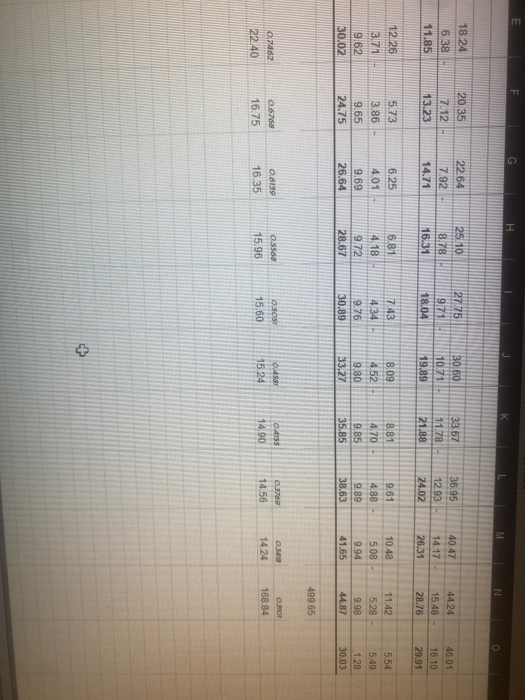
119.93 119.09 30.02 24.75 G 26.64 . 28.67 Terminal Value Discount Rate Discount factor PV Cash Flows 10.25% LOOO0 O.COZO 108.78 0.822 97.98 0.7462 22.40 0.009 0.6700 16.75 0.5569 16.35 15.96 Variance Current Scenario 159.24 51.15 Intrinsic Value Enterprise Value Plus: Cash Less: Debt Equity Value Number of shares Price per share New Stadium Scenario 108.08 48.08 64.40 91.76 9.29 9.88 142.45 50.68 15.33 5.46 30.03 Finding Terminal Value Perpetuity Growth Model FCF @ t=2020 erminal UFCF Growth Rate VACC Cerminal Value 4% 10.25% 499.65 C:\Users\shella Downloa ENHAM DCE MODEL. Build New Stadium Scenario.xlsxx Balans BUILD NEW STADIUM B D E F G . 2 2009 20 Revenue Attendance Sponsorship Broadcast Merchandise Other Total Revenue Current Forecast 0 1 2007 2008 17.40 18.97 15.70 17.11 28.70 31.28 520 5.67 7.10 7.74 74.10 80.77 20,67 18.65 34.10 6.18 8.44 88.04 3 2010 31.55 24.40 37.17 6.73 9.19 109.04 4 2011 34.39 26.59 40.51 7.34 5 2012 37.48 28.99 44.16 8.00 10.92 129.55 6 2013 40 85 31.60 48.13 8.72 11.91 141.21 2014 44.53 34.44 52.46 9.51 12.98 153.92 10.02 118.86 Operating Costs Payroll Stadium Operating Expenses Other Total Operating Cost 50.92 16.38 1.80 69.10 56.01 17.04 1.87 74.92 61.61 17.72 1.95 81.28 67.77 21.00 2.02 90.80 74.55 21.85 2.11 98.50 82 01 22.72 2.19 106.92 90 21 23.63 2.28 116.11 99.23 24 57 2.37 126.17 1 5.85 BITDA epreciation BIT 5.00 2.20 2.80 2.26 0.19 0.35 6.76 2.38 4.38 2.69 0.59 1.10 2.29 3.56 2.46 0.38 0.71 18.24 2.47 15.77 2.93 4.49 8.34 20.35 2.57 17.78 3.19 5.11 9.49 22.64 2.68 19.96 3.48 5.77 10.71 25.10 2.78 22.32 3.79 6.49 12.04 27.75 2.90 24.85 4.13 7.25 13.47 terest axes et Income ISCOUNTED CASH FLOW MODEL OF NEW STADIUM 5.85 6.76 BITDA x at 35% 18.24 6.38 11.85 22.64 7.92 2.05 20.35 7.12 13.23 25.10 8.78 2.37 27.75 9.71 18.04 29 14.71 16.31 Sheet10 K K M N 6 8 7 2014 10 2013 2015 39 59 5 2012 37 48 28.99 44.16 8.00 10.92 129.55 40.85 31.60 48.13 51 44.53 34 44 52.46 9.51 12.98 153.92 9 2016 52.91 40.92 62.33 11.29 15.42 182.87 2017 57.67 44.60 67.94 12.31 16.81 199.33 48.54 3754 57.19 10.36 14.15 167.77 11 2018 62.86 48.62 74.06 13.42 18.32 217.27 12 2019 68.52 52.99 80.72 14.63 19.97 236.83 13 2020 71.26 55.11 83.95 15.21 34 8.72 12 36 11.91 141.21 20.77 246,30 55 90.21 35 82 01 22.72 2.19 99.23 24 57 2.37 23.63 2.28 116.11 109.15 25.56 2.46 137.17 120.07 26.58 2.56 149.21 132.07 27.64 2.66 162.38 145.28 28.75 2.77 176.80 159.81 29.90 2.88 192.59 166 20 31.09 3.00 200.29 11 50 106.92 126.17 + 22.64 35 33.67 57 2.68 19.96 8 19 11 19 25.10 2.78 22.32 3.79 6.49 12.04 27.75 2.90 24.85 4.13 7.25 13.47 30.60 3.01 27.59 4.50 8.08 15.01 3.13 30.54 4.91 8.97 16.66 36.95 3.26 33.69 5.35 9.92 18.42 40.47 3.39 37.08 5.83 10.94 20.31 44.24 3.52 40.72 6.36 12.03 22.33 46.01 3.66 42.35 6.61 12.51 23.23 3.48 5.77 10.71 27.75 46.01 16.10 25.10 22.64 35 40.47 14.17 44 24 15.48 - 33.67 1178 30 60 10.71 36.95 1293 29.91 (Users sheila Downloads | TOTTENHAM DCF MODEL- 1. Build New Stadium Scenario.xlsxext. Bal. B DISCOUNTED CASH FLOW MODEL OF NEW STADIUM D E F G . 6.76 EBITDA Tax at 35% NOPAT 20 35 5.85 205 3.80 27.75 2.37 18.24 6.38 11.85 7.12 - 22.64 7.92 14.71 25.10 8.78 16.31 9.71 - 4.39 30.50 10.71 19.89 13.23 18.04 5.73 6.81 Change in WC Less:CAPEX Add: Depreciation Free Cash Flow (FCF) 3.90 128 43 0.80 119.93 3.86 - 4.25 128.57 0.83 119.09 12 26 3.71 9.62 30.02 4.18 6.25 4.01 - 9.69 26.64 8.09 4.52 9.65 7.43 4 34 9.76 30.89 24.75 9.72 28.67 9.80 33.27 10.25% Terminal Value Discount Rate Discount fortor PV Cash Flows LOOOO 0.8227 0.45 09070 108.78 0.7462 22.40 0876 16.75 0.6139 16.35 0556 15 96 OSOS 1560 97.98 15.24 Variance Current Scenario 159.24 51.15 Intrinsic Value Enterprise Value Plusi Cash Less! Debt Equity Value Number of shares Price per share New Stadium Scenario 108.08 48.08 14.40 91.76 9.29 9.88 142.45 50.68 15.33 5.46 + Finding Terminal Value Perpetuity Growth Model FCF @t=2020 Terminal UFCF Growth Rate 3 WACC Terminal Value 30.03 4% 10.25% 499.65 E F G H K N o 18.24 20.35 27175 7.12 6.38 11.85 22.64 7.92 - 14.71 25.10 8.78 16.31 30.60 10.71 19.89 9.71 18.04 33.67 11.78 21.88 36.95 12.93 - 24.02 40.47 14.17 26.31 44 24 15.48 - 28.76 46.01 16.10 29.91 13.23 12126 8.81 10.48 3.71 9.62 30.02 5.73 3.86 - 9.65 24.75 6.25 4.01 9.69 26.64 6.81 4.18 9.72 28.67 7.43 4.34 9.76 30.89 8.09 4.52 9.80 33.27 4.70 9.85 35.85 9.61 488 - 9.89 38.63 5.08 9.94 41.65 11.42 5.28 - 9.98 44.87 5.54 5.49 1 28 30.03 499 65 0.458 3769 0.7462 22.40 0.6700 16.75 0.6199 16.35 0.5568 15.96 OSOS 15.60 0.4155 14.90 0310 168.84 15.24 14.56 14 24 + 119.93 119.09 30.02 24.75 G 26.64 . 28.67 Terminal Value Discount Rate Discount factor PV Cash Flows 10.25% LOOO0 O.COZO 108.78 0.822 97.98 0.7462 22.40 0.009 0.6700 16.75 0.5569 16.35 15.96 Variance Current Scenario 159.24 51.15 Intrinsic Value Enterprise Value Plus: Cash Less: Debt Equity Value Number of shares Price per share New Stadium Scenario 108.08 48.08 64.40 91.76 9.29 9.88 142.45 50.68 15.33 5.46 30.03 Finding Terminal Value Perpetuity Growth Model FCF @ t=2020 erminal UFCF Growth Rate VACC Cerminal Value 4% 10.25% 499.65 C:\Users\shella Downloa ENHAM DCE MODEL. Build New Stadium Scenario.xlsxx Balans BUILD NEW STADIUM B D E F G . 2 2009 20 Revenue Attendance Sponsorship Broadcast Merchandise Other Total Revenue Current Forecast 0 1 2007 2008 17.40 18.97 15.70 17.11 28.70 31.28 520 5.67 7.10 7.74 74.10 80.77 20,67 18.65 34.10 6.18 8.44 88.04 3 2010 31.55 24.40 37.17 6.73 9.19 109.04 4 2011 34.39 26.59 40.51 7.34 5 2012 37.48 28.99 44.16 8.00 10.92 129.55 6 2013 40 85 31.60 48.13 8.72 11.91 141.21 2014 44.53 34.44 52.46 9.51 12.98 153.92 10.02 118.86 Operating Costs Payroll Stadium Operating Expenses Other Total Operating Cost 50.92 16.38 1.80 69.10 56.01 17.04 1.87 74.92 61.61 17.72 1.95 81.28 67.77 21.00 2.02 90.80 74.55 21.85 2.11 98.50 82 01 22.72 2.19 106.92 90 21 23.63 2.28 116.11 99.23 24 57 2.37 126.17 1 5.85 BITDA epreciation BIT 5.00 2.20 2.80 2.26 0.19 0.35 6.76 2.38 4.38 2.69 0.59 1.10 2.29 3.56 2.46 0.38 0.71 18.24 2.47 15.77 2.93 4.49 8.34 20.35 2.57 17.78 3.19 5.11 9.49 22.64 2.68 19.96 3.48 5.77 10.71 25.10 2.78 22.32 3.79 6.49 12.04 27.75 2.90 24.85 4.13 7.25 13.47 terest axes et Income ISCOUNTED CASH FLOW MODEL OF NEW STADIUM 5.85 6.76 BITDA x at 35% 18.24 6.38 11.85 22.64 7.92 2.05 20.35 7.12 13.23 25.10 8.78 2.37 27.75 9.71 18.04 29 14.71 16.31 Sheet10 K K M N 6 8 7 2014 10 2013 2015 39 59 5 2012 37 48 28.99 44.16 8.00 10.92 129.55 40.85 31.60 48.13 51 44.53 34 44 52.46 9.51 12.98 153.92 9 2016 52.91 40.92 62.33 11.29 15.42 182.87 2017 57.67 44.60 67.94 12.31 16.81 199.33 48.54 3754 57.19 10.36 14.15 167.77 11 2018 62.86 48.62 74.06 13.42 18.32 217.27 12 2019 68.52 52.99 80.72 14.63 19.97 236.83 13 2020 71.26 55.11 83.95 15.21 34 8.72 12 36 11.91 141.21 20.77 246,30 55 90.21 35 82 01 22.72 2.19 99.23 24 57 2.37 23.63 2.28 116.11 109.15 25.56 2.46 137.17 120.07 26.58 2.56 149.21 132.07 27.64 2.66 162.38 145.28 28.75 2.77 176.80 159.81 29.90 2.88 192.59 166 20 31.09 3.00 200.29 11 50 106.92 126.17 + 22.64 35 33.67 57 2.68 19.96 8 19 11 19 25.10 2.78 22.32 3.79 6.49 12.04 27.75 2.90 24.85 4.13 7.25 13.47 30.60 3.01 27.59 4.50 8.08 15.01 3.13 30.54 4.91 8.97 16.66 36.95 3.26 33.69 5.35 9.92 18.42 40.47 3.39 37.08 5.83 10.94 20.31 44.24 3.52 40.72 6.36 12.03 22.33 46.01 3.66 42.35 6.61 12.51 23.23 3.48 5.77 10.71 27.75 46.01 16.10 25.10 22.64 35 40.47 14.17 44 24 15.48 - 33.67 1178 30 60 10.71 36.95 1293 29.91 (Users sheila Downloads | TOTTENHAM DCF MODEL- 1. Build New Stadium Scenario.xlsxext. Bal. B DISCOUNTED CASH FLOW MODEL OF NEW STADIUM D E F G . 6.76 EBITDA Tax at 35% NOPAT 20 35 5.85 205 3.80 27.75 2.37 18.24 6.38 11.85 7.12 - 22.64 7.92 14.71 25.10 8.78 16.31 9.71 - 4.39 30.50 10.71 19.89 13.23 18.04 5.73 6.81 Change in WC Less:CAPEX Add: Depreciation Free Cash Flow (FCF) 3.90 128 43 0.80 119.93 3.86 - 4.25 128.57 0.83 119.09 12 26 3.71 9.62 30.02 4.18 6.25 4.01 - 9.69 26.64 8.09 4.52 9.65 7.43 4 34 9.76 30.89 24.75 9.72 28.67 9.80 33.27 10.25% Terminal Value Discount Rate Discount fortor PV Cash Flows LOOOO 0.8227 0.45 09070 108.78 0.7462 22.40 0876 16.75 0.6139 16.35 0556 15 96 OSOS 1560 97.98 15.24 Variance Current Scenario 159.24 51.15 Intrinsic Value Enterprise Value Plusi Cash Less! Debt Equity Value Number of shares Price per share New Stadium Scenario 108.08 48.08 14.40 91.76 9.29 9.88 142.45 50.68 15.33 5.46 + Finding Terminal Value Perpetuity Growth Model FCF @t=2020 Terminal UFCF Growth Rate 3 WACC Terminal Value 30.03 4% 10.25% 499.65 E F G H K N o 18.24 20.35 27175 7.12 6.38 11.85 22.64 7.92 - 14.71 25.10 8.78 16.31 30.60 10.71 19.89 9.71 18.04 33.67 11.78 21.88 36.95 12.93 - 24.02 40.47 14.17 26.31 44 24 15.48 - 28.76 46.01 16.10 29.91 13.23 12126 8.81 10.48 3.71 9.62 30.02 5.73 3.86 - 9.65 24.75 6.25 4.01 9.69 26.64 6.81 4.18 9.72 28.67 7.43 4.34 9.76 30.89 8.09 4.52 9.80 33.27 4.70 9.85 35.85 9.61 488 - 9.89 38.63 5.08 9.94 41.65 11.42 5.28 - 9.98 44.87 5.54 5.49 1 28 30.03 499 65 0.458 3769 0.7462 22.40 0.6700 16.75 0.6199 16.35 0.5568 15.96 OSOS 15.60 0.4155 14.90 0310 168.84 15.24 14.56 14 24 +
Step by Step Solution
There are 3 Steps involved in it

Get step-by-step solutions from verified subject matter experts