

Question: How did you find Net borrowing and equity repurchases? Can you show the step to find it........ Sales Growth Payout Ratio Tax Rate Int. Rate
How did you find Net borrowing and equity repurchases?
Can you show the step to find it........
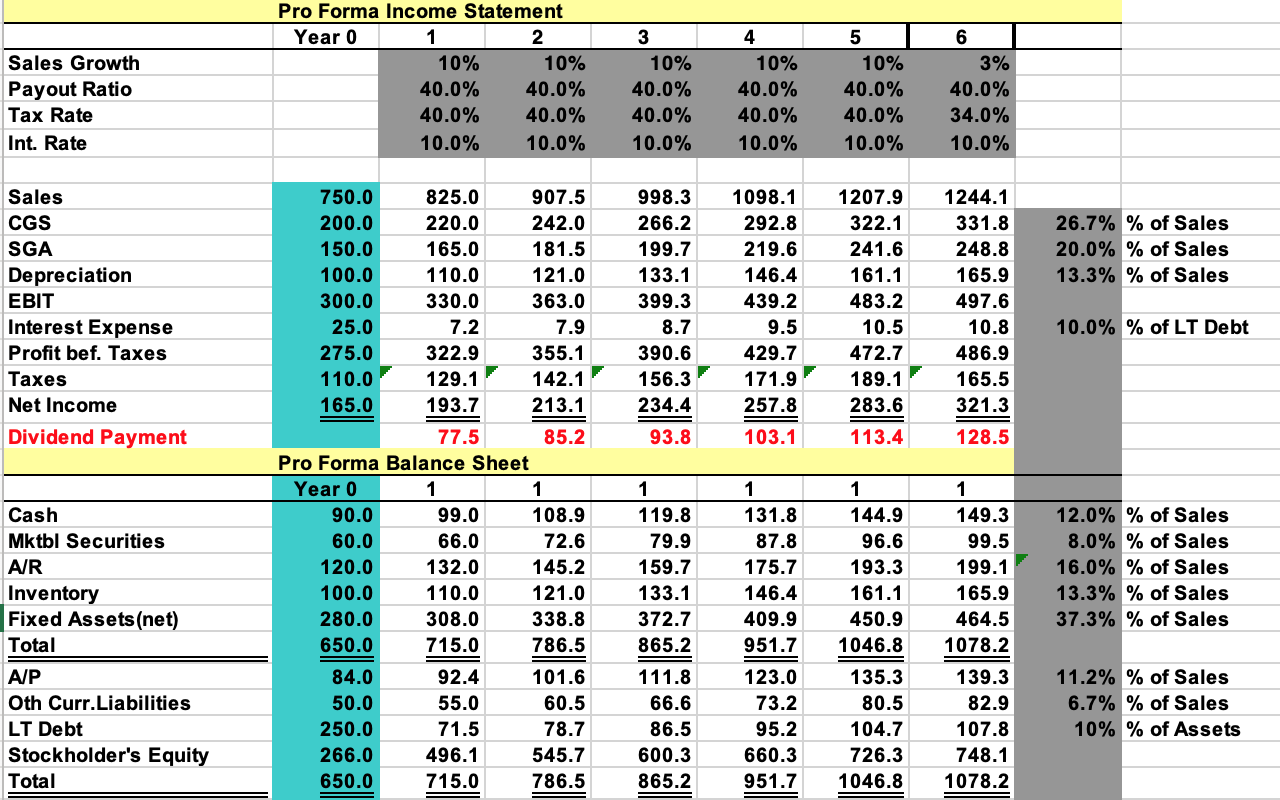
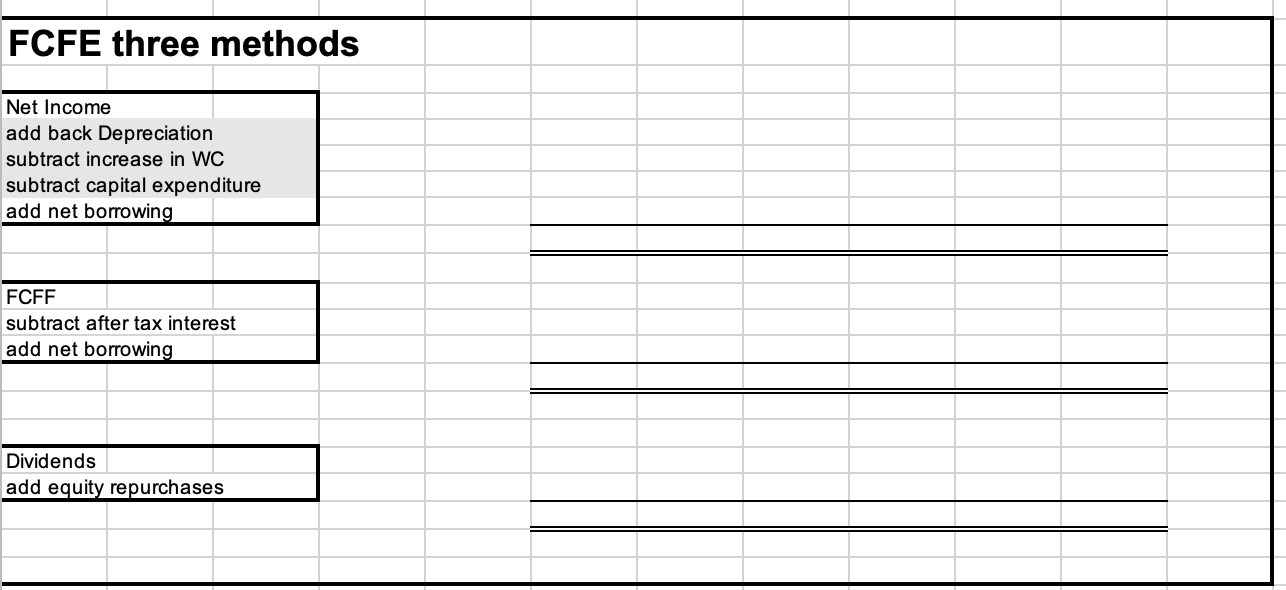
Sales Growth Payout Ratio Tax Rate Int. Rate Pro Forma Income Statement Year 0 1 2 10% 10% 40.0% 40.0% 40.0% 40.0% 10.0% 10.0% 3 10% 40.0% 40.0% 10.0% 4 10% 40.0% 40.0% 10.0% 5 10% 40.0% 40.0% 10.0% 6 3% 40.0% 34.0% 10.0% 26.7% % of Sales 20.0% % of Sales 13.3% % of Sales Sales CGS SGA Depreciation EBIT Interest Expense Profit bef. Taxes Taxes Net Income Dividend Payment 998.3 266.2 199.7 133.1 399.3 8.7 390.6 156.3 234.4 1098.1 292.8 219.6 146.4 439.2 9.5 429.7 171.9 257.8 103.1 1207.9 322.1 241.6 161.1 483.2 10.5 472.7 189.1 283.6 113.4 1244.1 331.8 248.8 165.9 497.6 10.8 486.9 165.5 321.3 128.5 10.0% % of LT Debt 93.8 750.0 825.0 907.5 200.0 220.0 242.0 150.0 165.0 181.5 100.0 110.0 121.0 300.0 330.0 363.0 25.0 7.2 7.9 275.0 322.9 355.1 110.0 129.1 142.1 165.0 193.7 213.1 77.5 85.2 Pro Forma Balance heet Year 0 1 1 90.0 99.0 108.9 60.0 66.0 72.6 120.0 132.0 145.2 100.0 110.0 121.0 280.0 308.0 338.8 650.0 715.0 786.5 84.0 92.4 101.6 50.0 55.0 60.5 250.0 71.5 78.7 266.0 496.1 545.7 650.0 715.0 786.5 1 1 12.0% % of Sales 8.0% % of Sales 16.0% % of Sales 13.3% % of Sales 37.3% % of Sales Cash Mktbl Securities AIR Inventory Fixed Assets (net) Total A/P Oth Curr.Liabilities LT Debt Stockholder's Equity Total 119.8 79.9 159.7 133.1 372.7 865.2 111.8 66.6 86.5 600.3 865.2 131.8 87.8 175.7 146.4 409.9 951.7 123.0 73.2 95.2 660.3 951.7 1 144.9 96.6 193.3 161.1 450.9 1046.8 135.3 80.5 104.7 726.3 1046.8 1 149.3 99.5 199.1 165.9 464.5 1078.2 139.3 82.9 107.8 748.1 1078.2 11.2% % of Sales 6.7% % of Sales 10% % of Assets FCFE three methods Net Income add back Depreciation subtract increase in WC subtract capital expenditure add net borrowing FCFF subtract after tax interest add net borrowing Dividends add equity repurchases Sales Growth Payout Ratio Tax Rate Int. Rate Pro Forma Income Statement Year 0 1 2 10% 10% 40.0% 40.0% 40.0% 40.0% 10.0% 10.0% 3 10% 40.0% 40.0% 10.0% 4 10% 40.0% 40.0% 10.0% 5 10% 40.0% 40.0% 10.0% 6 3% 40.0% 34.0% 10.0% 26.7% % of Sales 20.0% % of Sales 13.3% % of Sales Sales CGS SGA Depreciation EBIT Interest Expense Profit bef. Taxes Taxes Net Income Dividend Payment 998.3 266.2 199.7 133.1 399.3 8.7 390.6 156.3 234.4 1098.1 292.8 219.6 146.4 439.2 9.5 429.7 171.9 257.8 103.1 1207.9 322.1 241.6 161.1 483.2 10.5 472.7 189.1 283.6 113.4 1244.1 331.8 248.8 165.9 497.6 10.8 486.9 165.5 321.3 128.5 10.0% % of LT Debt 93.8 750.0 825.0 907.5 200.0 220.0 242.0 150.0 165.0 181.5 100.0 110.0 121.0 300.0 330.0 363.0 25.0 7.2 7.9 275.0 322.9 355.1 110.0 129.1 142.1 165.0 193.7 213.1 77.5 85.2 Pro Forma Balance heet Year 0 1 1 90.0 99.0 108.9 60.0 66.0 72.6 120.0 132.0 145.2 100.0 110.0 121.0 280.0 308.0 338.8 650.0 715.0 786.5 84.0 92.4 101.6 50.0 55.0 60.5 250.0 71.5 78.7 266.0 496.1 545.7 650.0 715.0 786.5 1 1 12.0% % of Sales 8.0% % of Sales 16.0% % of Sales 13.3% % of Sales 37.3% % of Sales Cash Mktbl Securities AIR Inventory Fixed Assets (net) Total A/P Oth Curr.Liabilities LT Debt Stockholder's Equity Total 119.8 79.9 159.7 133.1 372.7 865.2 111.8 66.6 86.5 600.3 865.2 131.8 87.8 175.7 146.4 409.9 951.7 123.0 73.2 95.2 660.3 951.7 1 144.9 96.6 193.3 161.1 450.9 1046.8 135.3 80.5 104.7 726.3 1046.8 1 149.3 99.5 199.1 165.9 464.5 1078.2 139.3 82.9 107.8 748.1 1078.2 11.2% % of Sales 6.7% % of Sales 10% % of Assets FCFE three methods Net Income add back Depreciation subtract increase in WC subtract capital expenditure add net borrowing FCFF subtract after tax interest add net borrowing Dividends add equity repurchases
Step by Step Solution
There are 3 Steps involved in it

Get step-by-step solutions from verified subject matter experts