

How do different clothing retailers relate to different income groups? You are a consultant for a...
Fantastic news! We've Found the answer you've been seeking!
Question:
Transcribed Image Text:
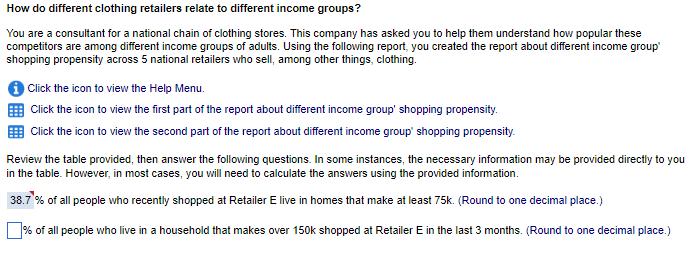
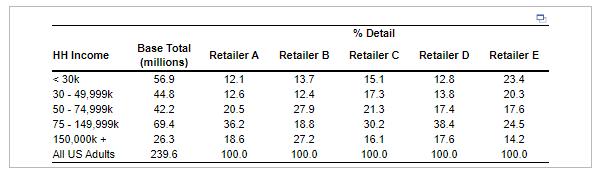
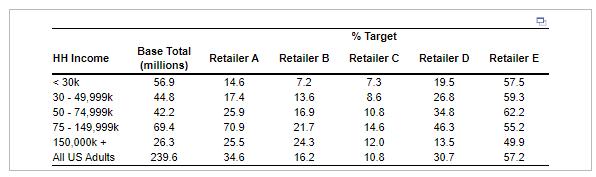
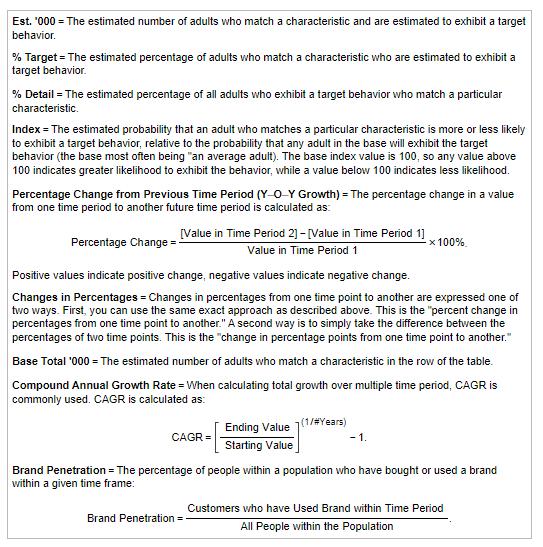
How do different clothing retailers relate to different income groups? You are a consultant for a national chain of clothing stores. This company has asked you to help them understand how popular these competitors are among different income groups of adults. Using the following report, you created the report about different income group' shopping propensity across 5 national retailers who sell, among other things, clothing. Click the icon to view the Help Menu. Click the icon to view the first part of the report about different income group' shopping propensity. Click the icon to view the second part of the report about different income group' shopping propensity. Review the table provided, then answer the following questions. In some instances, the necessary information may be provided directly to you in the table. However, in most cases, you will need to calculate the answers using the provided information. 38.7% of all people who recently shopped at Retailer E live in homes that make at least 75k. (Round to one decimal place.) % of all people who live in a household that makes over 150k shopped at Retailer E in the last 3 months. (Round to one decimal place.) HH Income < 30k 30 - 49,999k 50 -74,999k 75 - 149,999k 150,000k + All US Adults Base Total (millions) 56.9 44.8 42.2 69.4 26.3 239.6 Retailer A 12.1 12.6 20.5 36.2 18.6 100.0 Retailer B 13.7 12.4 27.9 18.8 27.2 100.0 % Detail Retailer C 15.1 17.3 21.3 30.2 16.1 100.0 Retailer D 12.8 13.8 17.4 38.4 17.6 100.0 Retailer E 23.4 20.3 17.6 24.5 14.2 100.0 HH Income < 30k 30 - 49,999k 50 -74,999k 75 - 149,999k 150,000K + All US Adults Base Total (millions) 56.9 44.8 42.2 69.4 26.3 239.6 Retailer A 14.6 17.4 25.9 70.9 25.5 34.6 Retailer B 7.2 13.6 16.9 21.7 24.3 16.2 % Target Retailer C 7.3 8.6 10.8 14.6 12.0 10.8 Retailer D 19.5 26.8 34.8 46.3 13.5 30.7 Retailer E 57.5 59.3 62.2 55.2 49.9 57.2 Est. '000 = The estimated number of adults who match a characteristic and are estimated to exhibit a target behavior. % Target = The estimated percentage of adults who match a characteristic who are estimated to exhibit a target behavior. % Detail = The estimated percentage of all adults who exhibit a target behavior who match a particular characteristic. Index = The estimated probability that an adult who matches a particular characteristic is more or less likely to exhibit a target behavior, relative to the probability that any adult in the base will exhibit the target behavior (the base most often being "an average adult). The base index value is 100, so any value above 100 indicates greater likelihood to exhibit the behavior, while a value below 100 indicates less likelihood. Percentage Change from Previous Time Period (Y-O-Y Growth) = The percentage change in a value from one time period to another future time period is calculated as: Percentage Change = [Value in Time Period 2]-[Value in Time Period 1] Value in Time Period 1 Positive values indicate positive change, negative values indicate negative change. Changes in Percentages = Changes in percentages from one time point to another are expressed one of two ways. First, you can use the same exact approach as described above. This is the "percent change in percentages from one time point to another." A second way is to simply take the difference between the percentages of two time points. This is the "change in percentage points from one time point to another." Base Total '000 = The estimated number of adults who match a characteristic in the row of the table. Compound Annual Growth Rate = When calculating total growth over multiple time period, CAGR is commonly used. CAGR is calculated as: CAGR = x 100% Ending Value (1/#Years) Starting Value Brand Penetration = - 1. Brand Penetration = The percentage of people within a population who have bought or used a brand within a given time frame: Customers who have Used Brand within Time Period All People within the Population How do different clothing retailers relate to different income groups? You are a consultant for a national chain of clothing stores. This company has asked you to help them understand how popular these competitors are among different income groups of adults. Using the following report, you created the report about different income group' shopping propensity across 5 national retailers who sell, among other things, clothing. Click the icon to view the Help Menu. Click the icon to view the first part of the report about different income group' shopping propensity. Click the icon to view the second part of the report about different income group' shopping propensity. Review the table provided, then answer the following questions. In some instances, the necessary information may be provided directly to you in the table. However, in most cases, you will need to calculate the answers using the provided information. 38.7% of all people who recently shopped at Retailer E live in homes that make at least 75k. (Round to one decimal place.) % of all people who live in a household that makes over 150k shopped at Retailer E in the last 3 months. (Round to one decimal place.) HH Income < 30k 30 - 49,999k 50 -74,999k 75 - 149,999k 150,000k + All US Adults Base Total (millions) 56.9 44.8 42.2 69.4 26.3 239.6 Retailer A 12.1 12.6 20.5 36.2 18.6 100.0 Retailer B 13.7 12.4 27.9 18.8 27.2 100.0 % Detail Retailer C 15.1 17.3 21.3 30.2 16.1 100.0 Retailer D 12.8 13.8 17.4 38.4 17.6 100.0 Retailer E 23.4 20.3 17.6 24.5 14.2 100.0 HH Income < 30k 30 - 49,999k 50 -74,999k 75 - 149,999k 150,000K + All US Adults Base Total (millions) 56.9 44.8 42.2 69.4 26.3 239.6 Retailer A 14.6 17.4 25.9 70.9 25.5 34.6 Retailer B 7.2 13.6 16.9 21.7 24.3 16.2 % Target Retailer C 7.3 8.6 10.8 14.6 12.0 10.8 Retailer D 19.5 26.8 34.8 46.3 13.5 30.7 Retailer E 57.5 59.3 62.2 55.2 49.9 57.2 Est. '000 = The estimated number of adults who match a characteristic and are estimated to exhibit a target behavior. % Target = The estimated percentage of adults who match a characteristic who are estimated to exhibit a target behavior. % Detail = The estimated percentage of all adults who exhibit a target behavior who match a particular characteristic. Index = The estimated probability that an adult who matches a particular characteristic is more or less likely to exhibit a target behavior, relative to the probability that any adult in the base will exhibit the target behavior (the base most often being "an average adult). The base index value is 100, so any value above 100 indicates greater likelihood to exhibit the behavior, while a value below 100 indicates less likelihood. Percentage Change from Previous Time Period (Y-O-Y Growth) = The percentage change in a value from one time period to another future time period is calculated as: Percentage Change = [Value in Time Period 2]-[Value in Time Period 1] Value in Time Period 1 Positive values indicate positive change, negative values indicate negative change. Changes in Percentages = Changes in percentages from one time point to another are expressed one of two ways. First, you can use the same exact approach as described above. This is the "percent change in percentages from one time point to another." A second way is to simply take the difference between the percentages of two time points. This is the "change in percentage points from one time point to another." Base Total '000 = The estimated number of adults who match a characteristic in the row of the table. Compound Annual Growth Rate = When calculating total growth over multiple time period, CAGR is commonly used. CAGR is calculated as: CAGR = x 100% Ending Value (1/#Years) Starting Value Brand Penetration = - 1. Brand Penetration = The percentage of people within a population who have bought or used a brand within a given time frame: Customers who have Used Brand within Time Period All People within the Population
Expert Answer:
Answer rating: 100% (QA)
According to the table the percentage of all people who recently shopped at Retailer ... View the full answer

Related Book For 

Business Statistics
ISBN: 9780321925831
3rd Edition
Authors: Norean Sharpe, Richard Veaux, Paul Velleman
Posted Date:
Students also viewed these general management questions
-
You are a consultant who helps new entrepreneurs set up their accounting systems. You are frequently asked the following questions about inventory: What are internal controls? Why do I need to...
-
You are a consultant for Securitor Inc. (SI). SI, founded by "reformed" hackers, provides security and privacy audits for companies with an online presence. SI has been asked by a client to help them...
-
Your friend has asked you to help them understand any potential problems that might arise in a model they have been asked to analyse. The model your friend has estimated is based on the Capital Asset...
-
Draw the array's dimensions and contents of the following initialized two-dimensional arrays: 1) 2) int[][] arr1= new int [3] [4]; arr1 [0] [1]-5; arrl [0] [2] = 10: arrl [1] [2]-7; arri [0] [3] = 9;...
-
Frito-Lay has flourished since its origin-the 1931 purchases of a small San Antonio firm for $100 that included a recipe, 19 retail accounts, and a hand-operated potato ricer. The...
-
Ben runs a general store. Which of the following items are drawings? Money taken from till to pay staff. Money taken from till to buy Bens wife a bunch of flowers for her birthday. Money taken...
-
De-Lavel turbine is normally used for _______ pressure and _______ Speed.
-
Janet Wooster owns a retail store that sells new and used sporting equipment. Janet has requested a cash budget for October. After examining the records of the company, you find the following: a....
-
What is MATLAB? Pros and cons.
-
Alfonso Inc. acquired 100 percent of the voting shares of BelAire Company on January 1, 2020. In exchange, Alfonso paid $198,000 in cash and issued 100,000 shares of its own $1 par value common...
-
Claras portfolio is worth $200,000 and her portfolio consists of common stocks worth $56,000. Therefore, equity constitutes _____ of Claras portfolio. a. 28% b. 61% c. 56% d. 10% e. 33%
-
The minimum acceptable standard for ethical behavior is compliance with the law.(True/False)
-
A release is an agreement in which one party gives up the right to pursue a legal claim against another party. (True/False)
-
In mediation, a mediator decides on the matter in dispute.(True/False)
-
What does equal protection mean?
-
Vern offers to sell his car to Lee, stating that the offer will stay open for thirty days. Vern a. cannot revoke the offer for thirty days. b. can revoke the offer after any reasonable period of...
-
Ulysses Inc., a publicly traded toy manufacturing company, is considering investing in a 5-year joint venture with Lowie Inc, a movie company, to produce animated movies. You have been provided with...
-
In your readings, there were many examples given for nurturing close family relationships in this ever-evolving technological society we live in Based upon your readings and research describe three...
-
Does it matter what kind of tee a golfer places the ball on? The company that manufactures Stinger tees claims that the thinner shaft and smaller head will lessen resistance and drag, reducing spin...
-
For the data in Exercise 1: a) Draw a boxplot using the quartiles from Exercise 7b. b) Does the boxplot nominate any outliers? c) What age would be considered a high outlier?
-
The histogram shows the monthly U.S. unemployment rate from January 2003 to January 2013 (data.bls.gov/timeseries/LNS14000000). Here is the time series plot for the same data. a) What features of the...
-
Remmers Travel Agency purchased land for 85,000 cash on December 10, 2025. At December 31, 2025, the lands value has increased to 93,000. What amount should be reported for land on Remmers statement...
-
As of December 31, 2025, Stoneland AG has assets of 3,500 and equity of 2,000. What are the liabilities for Stoneland AG as of December 31, 2025? a. 1,500. b. 1,000. c. 2,500. d. 2,000.
-
Performing services on account will have the following effects on the components of the basic accounting equation: a. increase assets and decrease equity. b. increase assets and increase equity. c....

Study smarter with the SolutionInn App