

Question: How do I answer this boxplot question? BoxPlot 10 20 30 40 50 60 70 80 90 SPREAD (c) From the boxplot, approximate the following
How do I answer this boxplot question?
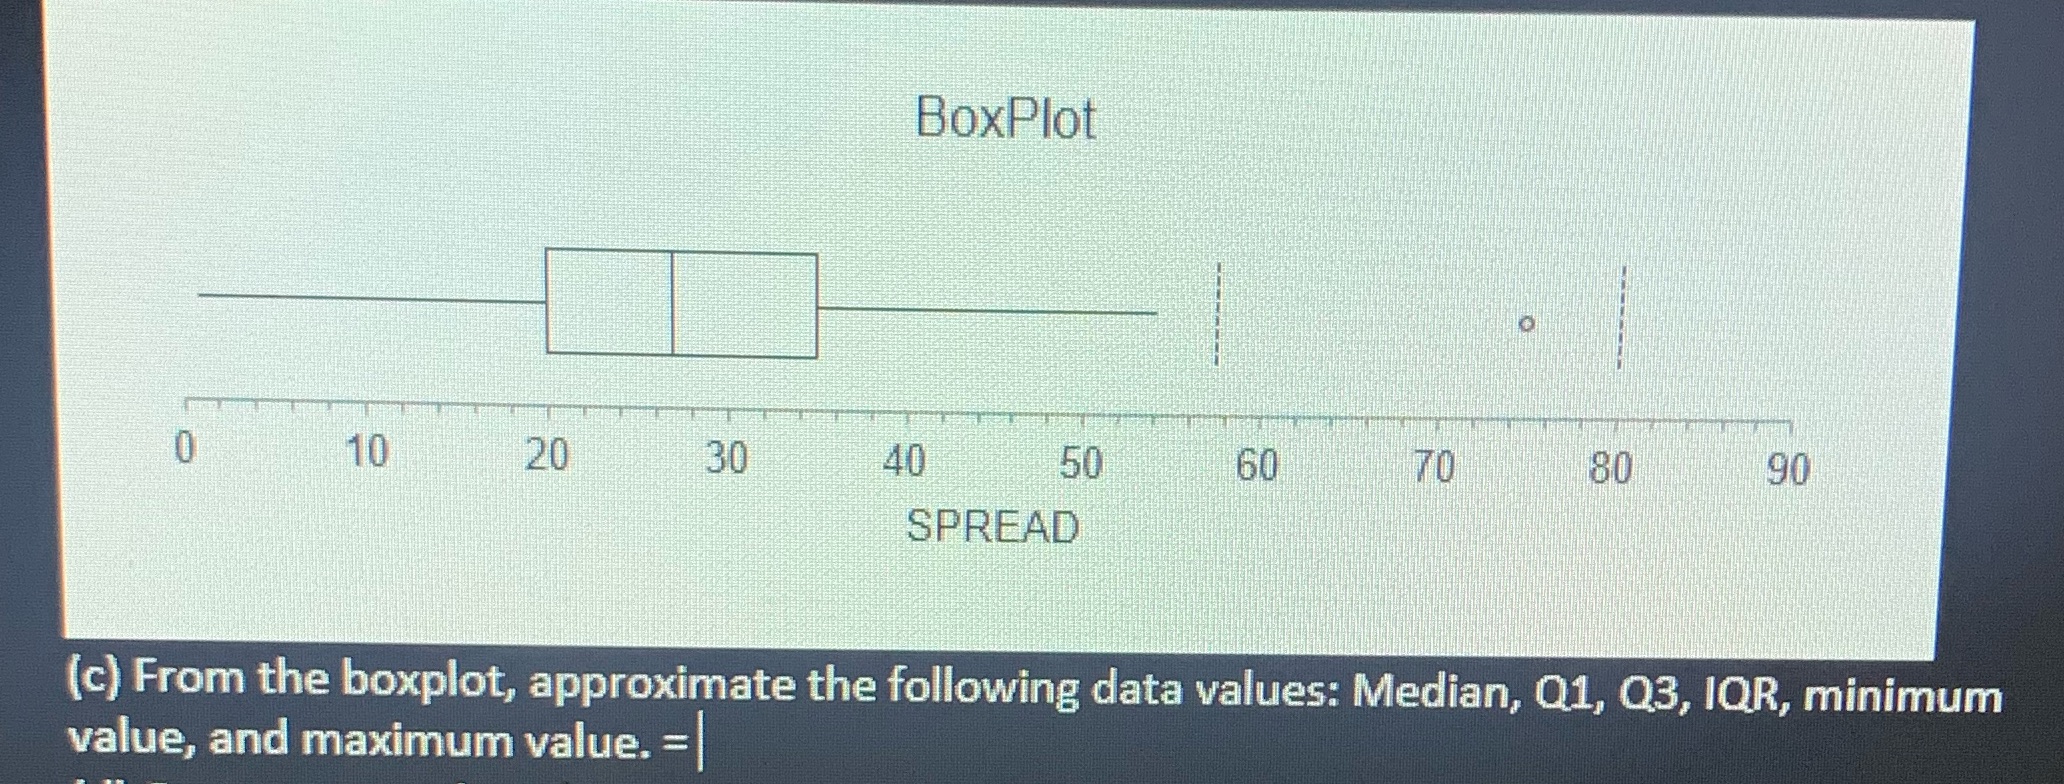
BoxPlot 10 20 30 40 50 60 70 80 90 SPREAD (c) From the boxplot, approximate the following data values: Median, Q1, Q3, IQR, minimum value, and maximum value. =
Step by Step Solution
There are 3 Steps involved in it
1 Expert Approved Answer
Step: 1 Unlock

Question Has Been Solved by an Expert!
Get step-by-step solutions from verified subject matter experts
Step: 2 Unlock
Step: 3 Unlock