

Question: how do i answer this using r studio? (1 point) Does the color of your team uniform affect your performance? That's what researchers in England
 how do i answer this using r studio?
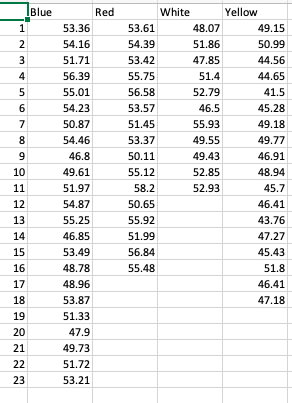
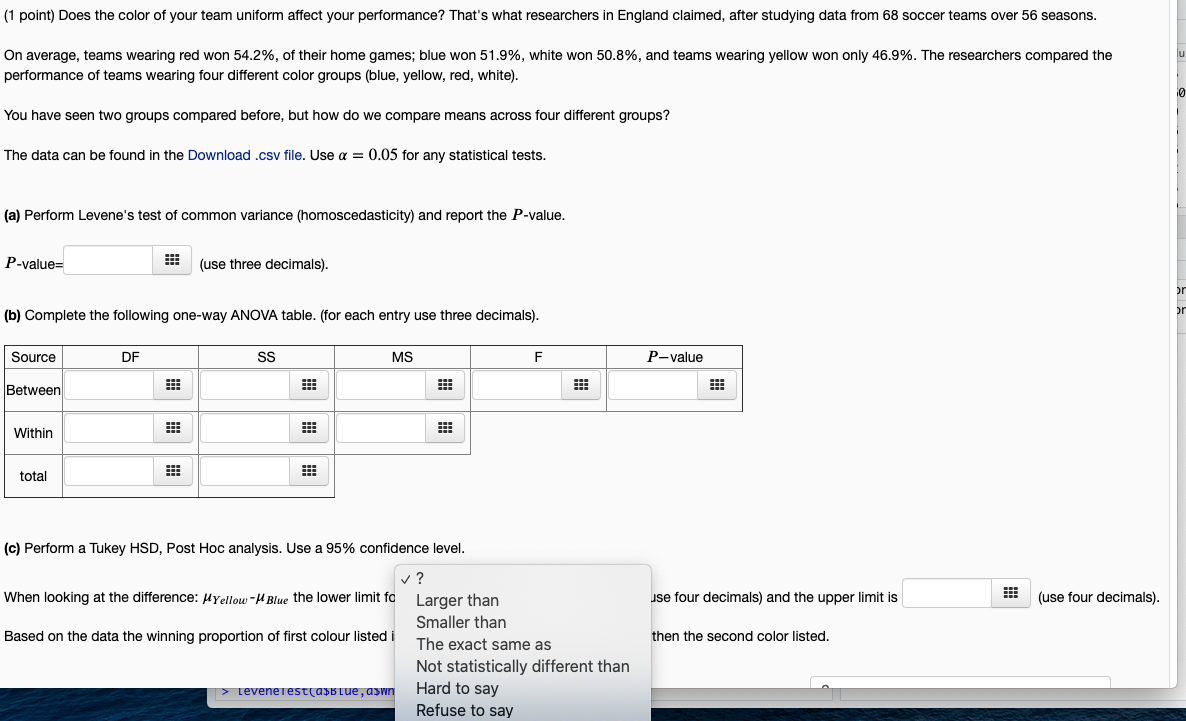
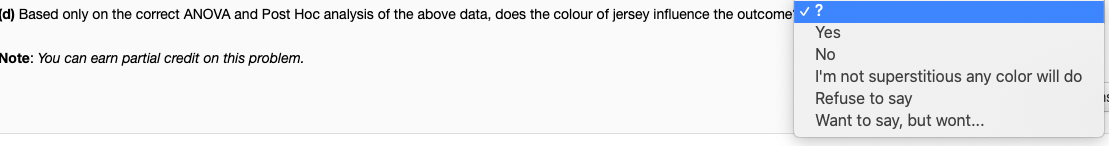
(1 point) Does the color of your team uniform affect your performance? That's what researchers in England claimed, after studying data from 68 soccer teams over 56 seasons. On average, teams wearing red won 54.2%, of their home games; blue won 51.9%, white won 50.8%, and teams wearing yellow won only 46.9%. The researchers compared the performance of teams wearing four different color groups (blue, yellow, red, white). You have seen two groups compared before, but how do we compare means across four different groups? The data can be found in the Download .csv file. Use a = 0.05 for any statistical tests. (a) Perform Levene's test of common variance (homoscedasticity) and report the P-value. P-value= (use three decimals). or (b) Complete the following one-way ANOVA table. (for each entry use three decimals). Source DF SS MS F P-value Between Within HE total use four decimals) and the upper limit is (use four decimals). (c) Perform a Tukey HSD, Post Hoc analysis. Use a 95% confidence level. ? When looking at the difference: Myellow - Blue the lower limit fo Larger than Smaller than Based on the data the winning proportion of first colour listed i The exact same as Not statistically different than > Levenerest(a$Blue, awn Hard to say Refuse to say then the second color listed. (d) Based only on the correct ANOVA and Post Hoc analysis of the above data, does the colour of jersey influence the outcome? Yes No Note: You can earn partial credit on this problem. I'm not superstitious any color will do Refuse to say Want to say, but wont... Blue 1 2 3 4 5 6 7 8 9 10 11 12 13 Red 53.36 54.16 51.71 56.39 55.01 54.23 50.87 54.46 46.8 49.61 51.97 54.87 55.25 46.85 53.49 48.78 48.96 53.87 51.33 47.9 49.73 51.72 53.21 White Yellow 53.61 48.07 49.15 54.39 51.86 50.99 53.42 47.85 44.56 55.75 51.4 44.65 56.58 52.79 41.5 53.57 46.5 45.28 51.45 55.93 49.18 53.37 49.55 49.77 50.11 49.43 46.91 55.12 52.85 48.94 58.2 52.93 45.7 50.65 46.41 55.92 43.76 51.99 47.27 56.84 45.43 55.48 51.8 46.41 47.18 14 15 16 17 18 19 20 21 22 23 (1 point) Does the color of your team uniform affect your performance? That's what researchers in England claimed, after studying data from 68 soccer teams over 56 seasons. On average, teams wearing red won 54.2%, of their home games; blue won 51.9%, white won 50.8%, and teams wearing yellow won only 46.9%. The researchers compared the performance of teams wearing four different color groups (blue, yellow, red, white). You have seen two groups compared before, but how do we compare means across four different groups? The data can be found in the Download .csv file. Use a = 0.05 for any statistical tests. (a) Perform Levene's test of common variance (homoscedasticity) and report the P-value. P-value= (use three decimals). or (b) Complete the following one-way ANOVA table. (for each entry use three decimals). Source DF SS MS F P-value Between Within HE total use four decimals) and the upper limit is (use four decimals). (c) Perform a Tukey HSD, Post Hoc analysis. Use a 95% confidence level. ? When looking at the difference: Myellow - Blue the lower limit fo Larger than Smaller than Based on the data the winning proportion of first colour listed i The exact same as Not statistically different than > Levenerest(a$Blue, awn Hard to say Refuse to say then the second color listed. (d) Based only on the correct ANOVA and Post Hoc analysis of the above data, does the colour of jersey influence the outcome? Yes No Note: You can earn partial credit on this problem. I'm not superstitious any color will do Refuse to say Want to say, but wont... Blue 1 2 3 4 5 6 7 8 9 10 11 12 13 Red 53.36 54.16 51.71 56.39 55.01 54.23 50.87 54.46 46.8 49.61 51.97 54.87 55.25 46.85 53.49 48.78 48.96 53.87 51.33 47.9 49.73 51.72 53.21 White Yellow 53.61 48.07 49.15 54.39 51.86 50.99 53.42 47.85 44.56 55.75 51.4 44.65 56.58 52.79 41.5 53.57 46.5 45.28 51.45 55.93 49.18 53.37 49.55 49.77 50.11 49.43 46.91 55.12 52.85 48.94 58.2 52.93 45.7 50.65 46.41 55.92 43.76 51.99 47.27 56.84 45.43 55.48 51.8 46.41 47.18 14 15 16 17 18 19 20 21 22 23
Step by Step Solution
There are 3 Steps involved in it

Get step-by-step solutions from verified subject matter experts