

Question: how do I calculate the blanks for this chart? As we just discovered a monthly inventory is a method of determining the food cost percentage.
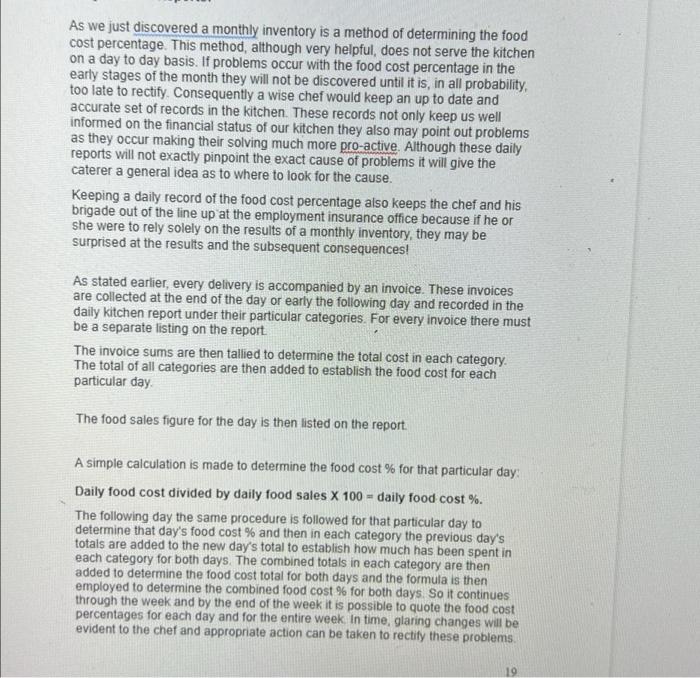
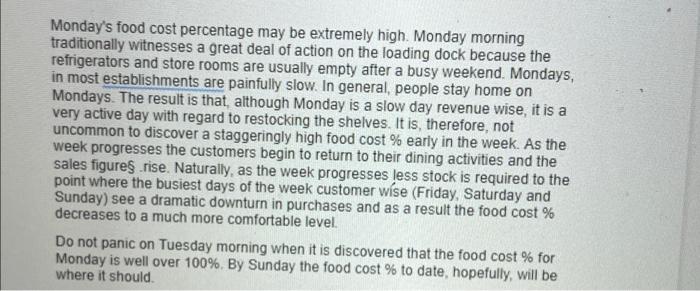
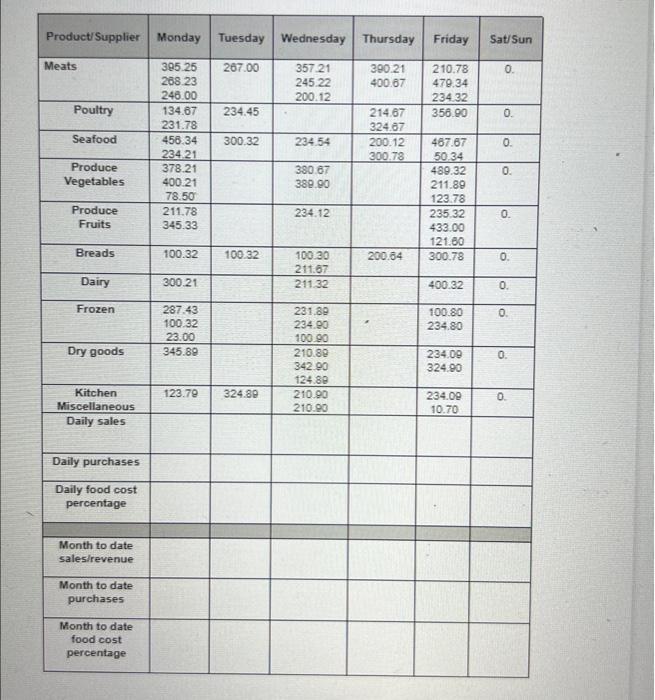
As we just discovered a monthly inventory is a method of determining the food cost percentage. This method, although very helpful, does not serve the kitchen on a day to day basis. If problems occur with the food cost percentage in the early stages of the month they will not be discovered until it is, in all probability, too late to rectify. Consequently a wise chef would keep an up to date and accurate set of records in the kitchen. These records not only keep us well informed on the financial status of our kitchen they also may point out problems as they occur making their solving much more pro-active. Although these daily reports will not exactly pinpoint the exact cause of problems it will give the caterer a general idea as to where to look for the cause. Keeping a daily record of the food cost percentage also keeps the chef and his brigade out of the line up at the employment insurance office because if he or she were to rely solely on the results of a monthly inventory, they may be surprised at the results and the subsequent consequences! As stated earlier, every delivery is accompanied by an invoice. These invoices are collected at the end of the day or early the following day and recorded in the daily kitchen report under their particular categories. For every invoice there must be a separate listing on the report The invoice sums are then tallied to determine the total cost in each category. The total of all categories are then added to establish the food cost for each particular day The food sales figure for the day is then listed on the report. A simple calculation is made to determine the food cost % for that particular day: Daily food cost divided by daily food sales X 100 - daily food cost %. The following day the same procedure is followed for that particular day to determine that day's food cost % and then in each category the previous day's totals are added to the new day's total to establish how much has been spent in each category for both days. The combined totals in each category are then added to determine the food cost total for both days and the formula is then employed to determine the combined food cost 96 for both days. So it continues through the week and by the end of the week it is possible to quote the food cost percentages for each day and for the entire week. In time, glaring changes will be evident to the chef and appropriate action can be taken to rectify these problems 19 Monday's food cost percentage may be extremely high. Monday morning traditionally witnesses a great deal of action on the loading dock because the refrigerators and store rooms are usually empty after a busy weekend. Mondays, in most establishments are painfully slow. In general, people stay home on Mondays. The result is that, although Monday is a slow day revenue wise, it is a very active day with regard to restocking the shelves. It is therefore, not uncommon to discover a staggeringly high food cost % early in the week. As the week progresses the customers begin to return to their dining activities and the sales figures rise. Naturally, as the week progresses less stock is required to the point where the busiest days of the week customer wise (Friday, Saturday and Sunday) see a dramatic downturn in purchases and as a result the food cost % decreases to a much more comfortable level. Do not panic on Tuesday morning when it is discovered that the food cost % for Monday is well over 100%. By Sunday the food cost % to date, hopefully, will be where it should Product/Supplier Monday Tuesday Wednesday Thursday Friday Sat/Sun Meats 207.00 0. 357.21 245.22 200.12 300.21 400.67 2 10.78 479.34 234 32 356.90 Poultry 234.45 0. Seafood 395.25 288 23 246.00 134.87 231.78 458.34 234 21 378.21 400.21 78.50 211.78 345.33 214.67 324.07 200.12 300.78 300.32 234 54 0. 0 Produce Vegetables 380 67 380.90 467.67 50.34 489.32 211.89 123.78 235 32 433.00 121.80 300.78 Produce Fruits 234.12 0. Breads 100.32 100 32 200.64 0. 100.30 211.07 211 32 Dairy 300.21 400.32 0. Frozen 0 287.43 100.32 23.00 345.89 100.80 234.80 Dry goods 231.89 234.00 100.90 210.89 342.90 124.89 210.90 210.90 234.09 324.90 0. 123.70 324.80 Kitchen Miscellaneous Daily sales 234.00 10.70 0. Daily purchases Daily food cost percentage Month to date sales/revenue Month to date purchases Month to date food cost percentage As we just discovered a monthly inventory is a method of determining the food cost percentage. This method, although very helpful, does not serve the kitchen on a day to day basis. If problems occur with the food cost percentage in the early stages of the month they will not be discovered until it is, in all probability, too late to rectify. Consequently a wise chef would keep an up to date and accurate set of records in the kitchen. These records not only keep us well informed on the financial status of our kitchen they also may point out problems as they occur making their solving much more pro-active. Although these daily reports will not exactly pinpoint the exact cause of problems it will give the caterer a general idea as to where to look for the cause. Keeping a daily record of the food cost percentage also keeps the chef and his brigade out of the line up at the employment insurance office because if he or she were to rely solely on the results of a monthly inventory, they may be surprised at the results and the subsequent consequences! As stated earlier, every delivery is accompanied by an invoice. These invoices are collected at the end of the day or early the following day and recorded in the daily kitchen report under their particular categories. For every invoice there must be a separate listing on the report The invoice sums are then tallied to determine the total cost in each category. The total of all categories are then added to establish the food cost for each particular day The food sales figure for the day is then listed on the report. A simple calculation is made to determine the food cost % for that particular day: Daily food cost divided by daily food sales X 100 - daily food cost %. The following day the same procedure is followed for that particular day to determine that day's food cost % and then in each category the previous day's totals are added to the new day's total to establish how much has been spent in each category for both days. The combined totals in each category are then added to determine the food cost total for both days and the formula is then employed to determine the combined food cost 96 for both days. So it continues through the week and by the end of the week it is possible to quote the food cost percentages for each day and for the entire week. In time, glaring changes will be evident to the chef and appropriate action can be taken to rectify these problems 19 Monday's food cost percentage may be extremely high. Monday morning traditionally witnesses a great deal of action on the loading dock because the refrigerators and store rooms are usually empty after a busy weekend. Mondays, in most establishments are painfully slow. In general, people stay home on Mondays. The result is that, although Monday is a slow day revenue wise, it is a very active day with regard to restocking the shelves. It is therefore, not uncommon to discover a staggeringly high food cost % early in the week. As the week progresses the customers begin to return to their dining activities and the sales figures rise. Naturally, as the week progresses less stock is required to the point where the busiest days of the week customer wise (Friday, Saturday and Sunday) see a dramatic downturn in purchases and as a result the food cost % decreases to a much more comfortable level. Do not panic on Tuesday morning when it is discovered that the food cost % for Monday is well over 100%. By Sunday the food cost % to date, hopefully, will be where it should Product/Supplier Monday Tuesday Wednesday Thursday Friday Sat/Sun Meats 207.00 0. 357.21 245.22 200.12 300.21 400.67 2 10.78 479.34 234 32 356.90 Poultry 234.45 0. Seafood 395.25 288 23 246.00 134.87 231.78 458.34 234 21 378.21 400.21 78.50 211.78 345.33 214.67 324.07 200.12 300.78 300.32 234 54 0. 0 Produce Vegetables 380 67 380.90 467.67 50.34 489.32 211.89 123.78 235 32 433.00 121.80 300.78 Produce Fruits 234.12 0. Breads 100.32 100 32 200.64 0. 100.30 211.07 211 32 Dairy 300.21 400.32 0. Frozen 0 287.43 100.32 23.00 345.89 100.80 234.80 Dry goods 231.89 234.00 100.90 210.89 342.90 124.89 210.90 210.90 234.09 324.90 0. 123.70 324.80 Kitchen Miscellaneous Daily sales 234.00 10.70 0. Daily purchases Daily food cost percentage Month to date sales/revenue Month to date purchases Month to date food cost percentage
Step by Step Solution
There are 3 Steps involved in it

Get step-by-step solutions from verified subject matter experts