

Question: How do i calculate this please show in excel and explain? For this question, round your answers to 3 decimal places and do not express
How do i calculate this please show in excel and explain?
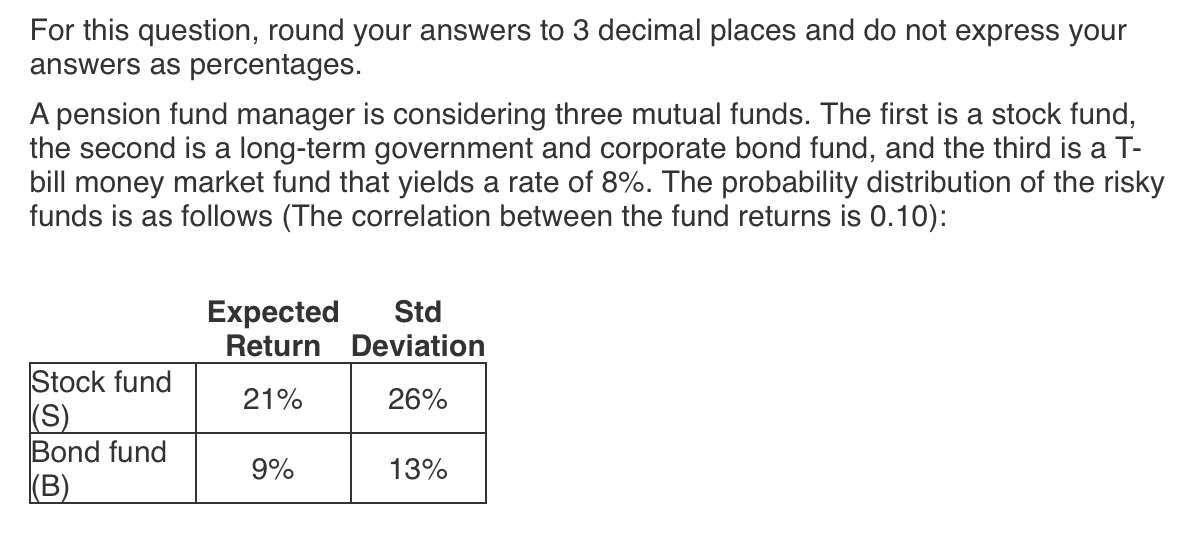
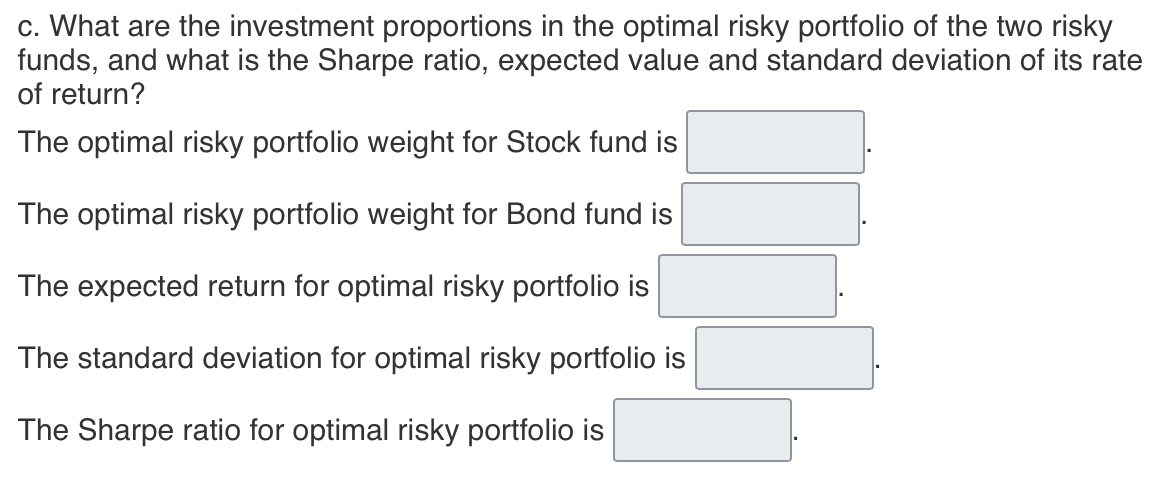
For this question, round your answers to 3 decimal places and do not express your answers as percentages. A pension fund manager is considering three mutual funds. The first is a stock fund, the second is a long-term government and corporate bond fund, and the third is a T bill money market fund that yields a rate of 8%. The probability distribution of the risky funds is as follows (The correlation between the fund returns is 0.10 ): c. What are the investment proportions in the optimal risky portfolio of the two risky funds, and what is the Sharpe ratio, expected value and standard deviation of its rate of return? The optimal risky portfolio weight for Stock fund is The optimal risky portfolio weight for Bond fund is The expected return for optimal risky portfolio is The standard deviation for optimal risky portfolio is The Sharpe ratio for optimal risky portfolio is
Step by Step Solution
There are 3 Steps involved in it

Get step-by-step solutions from verified subject matter experts