

Question: How do I calculate this problem. I need help to solve it. Thanks! John is a new college graduate working at his first job. After
How do I calculate this problem. I need help to solve it. Thanks!
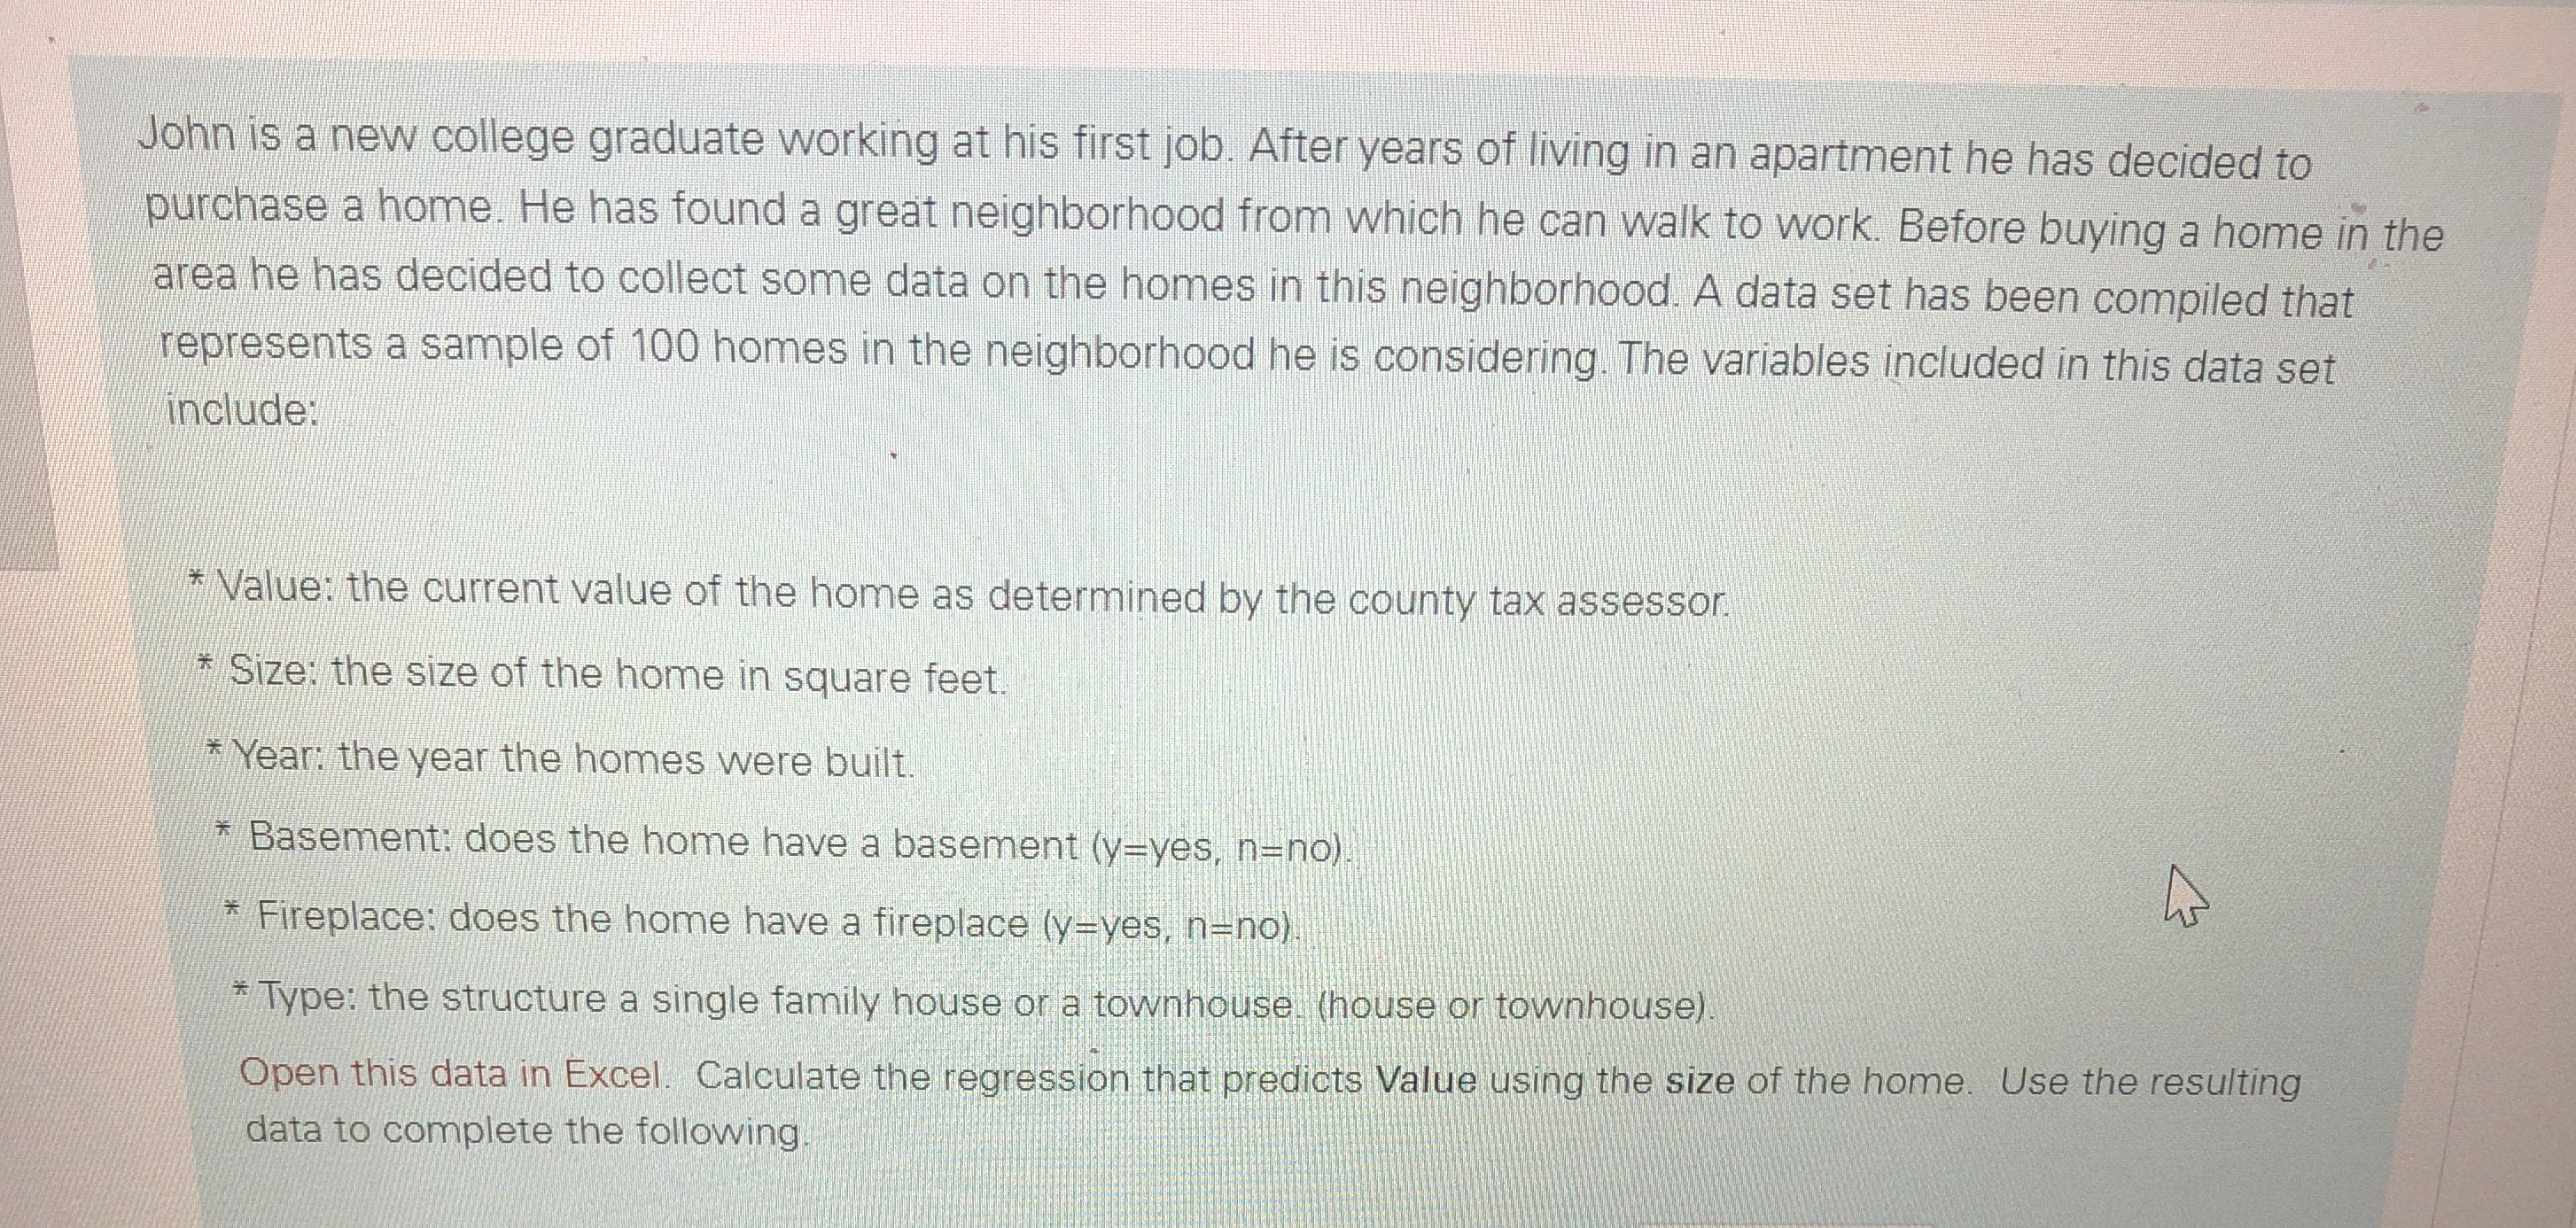
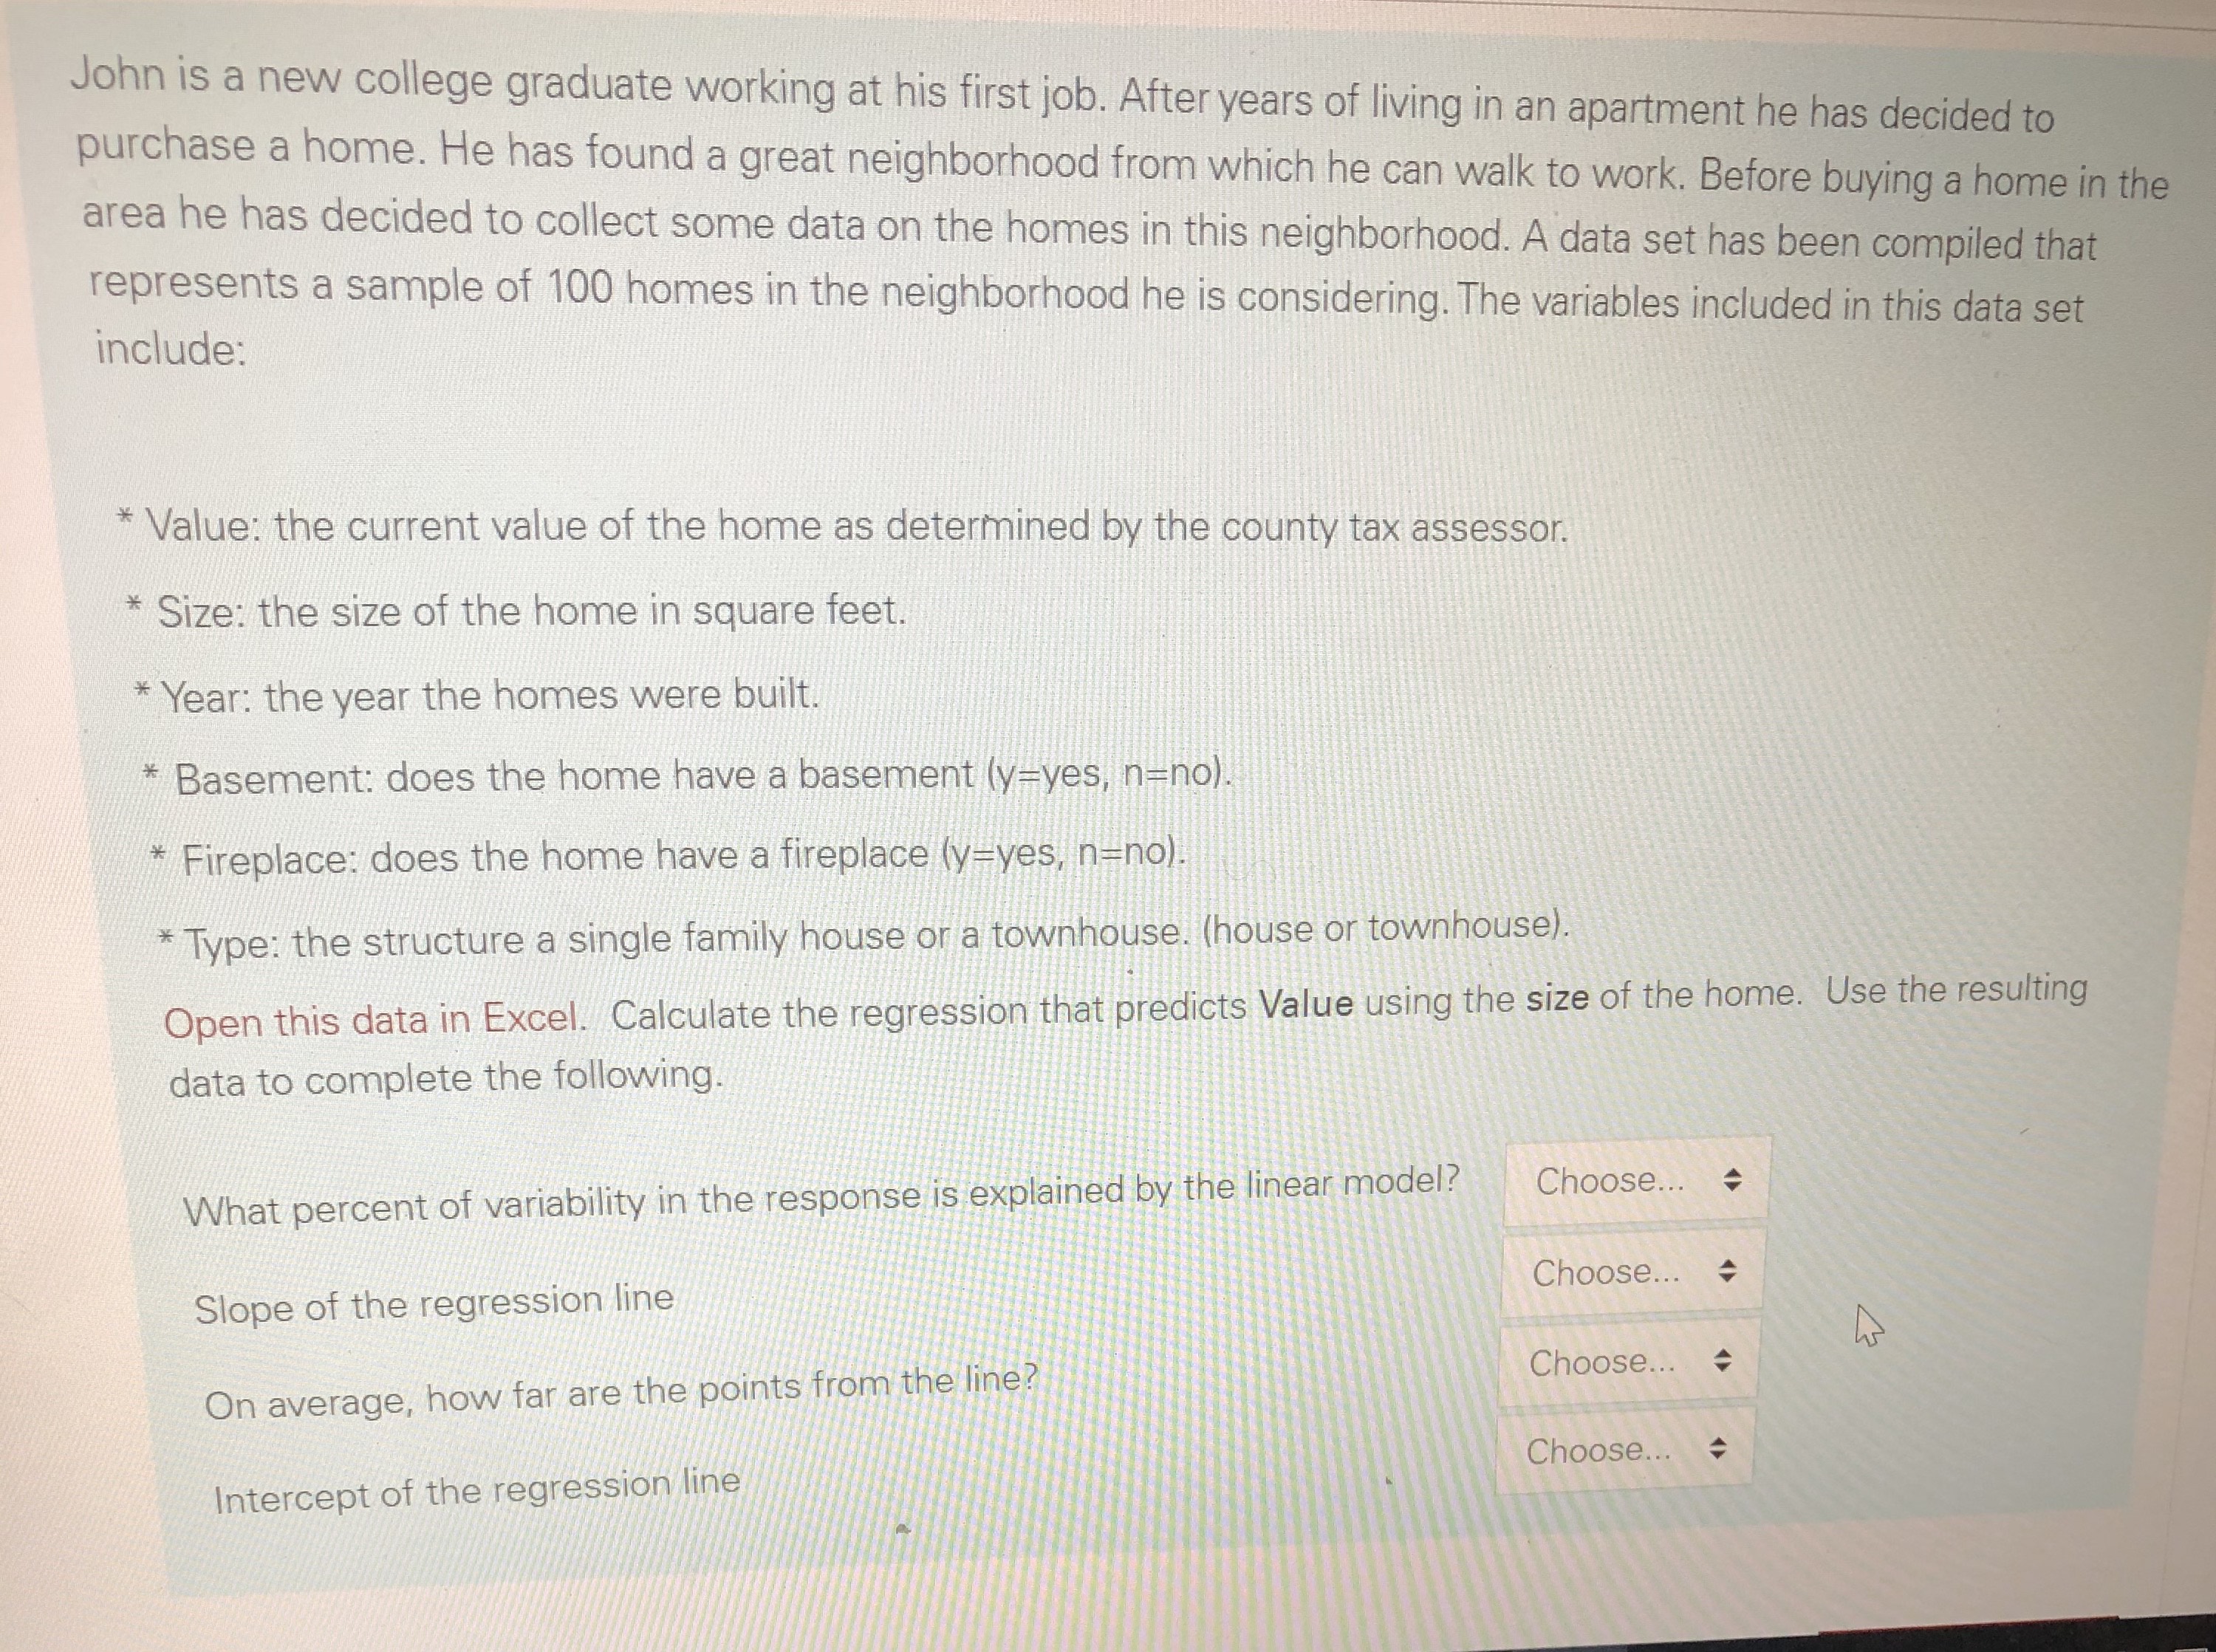
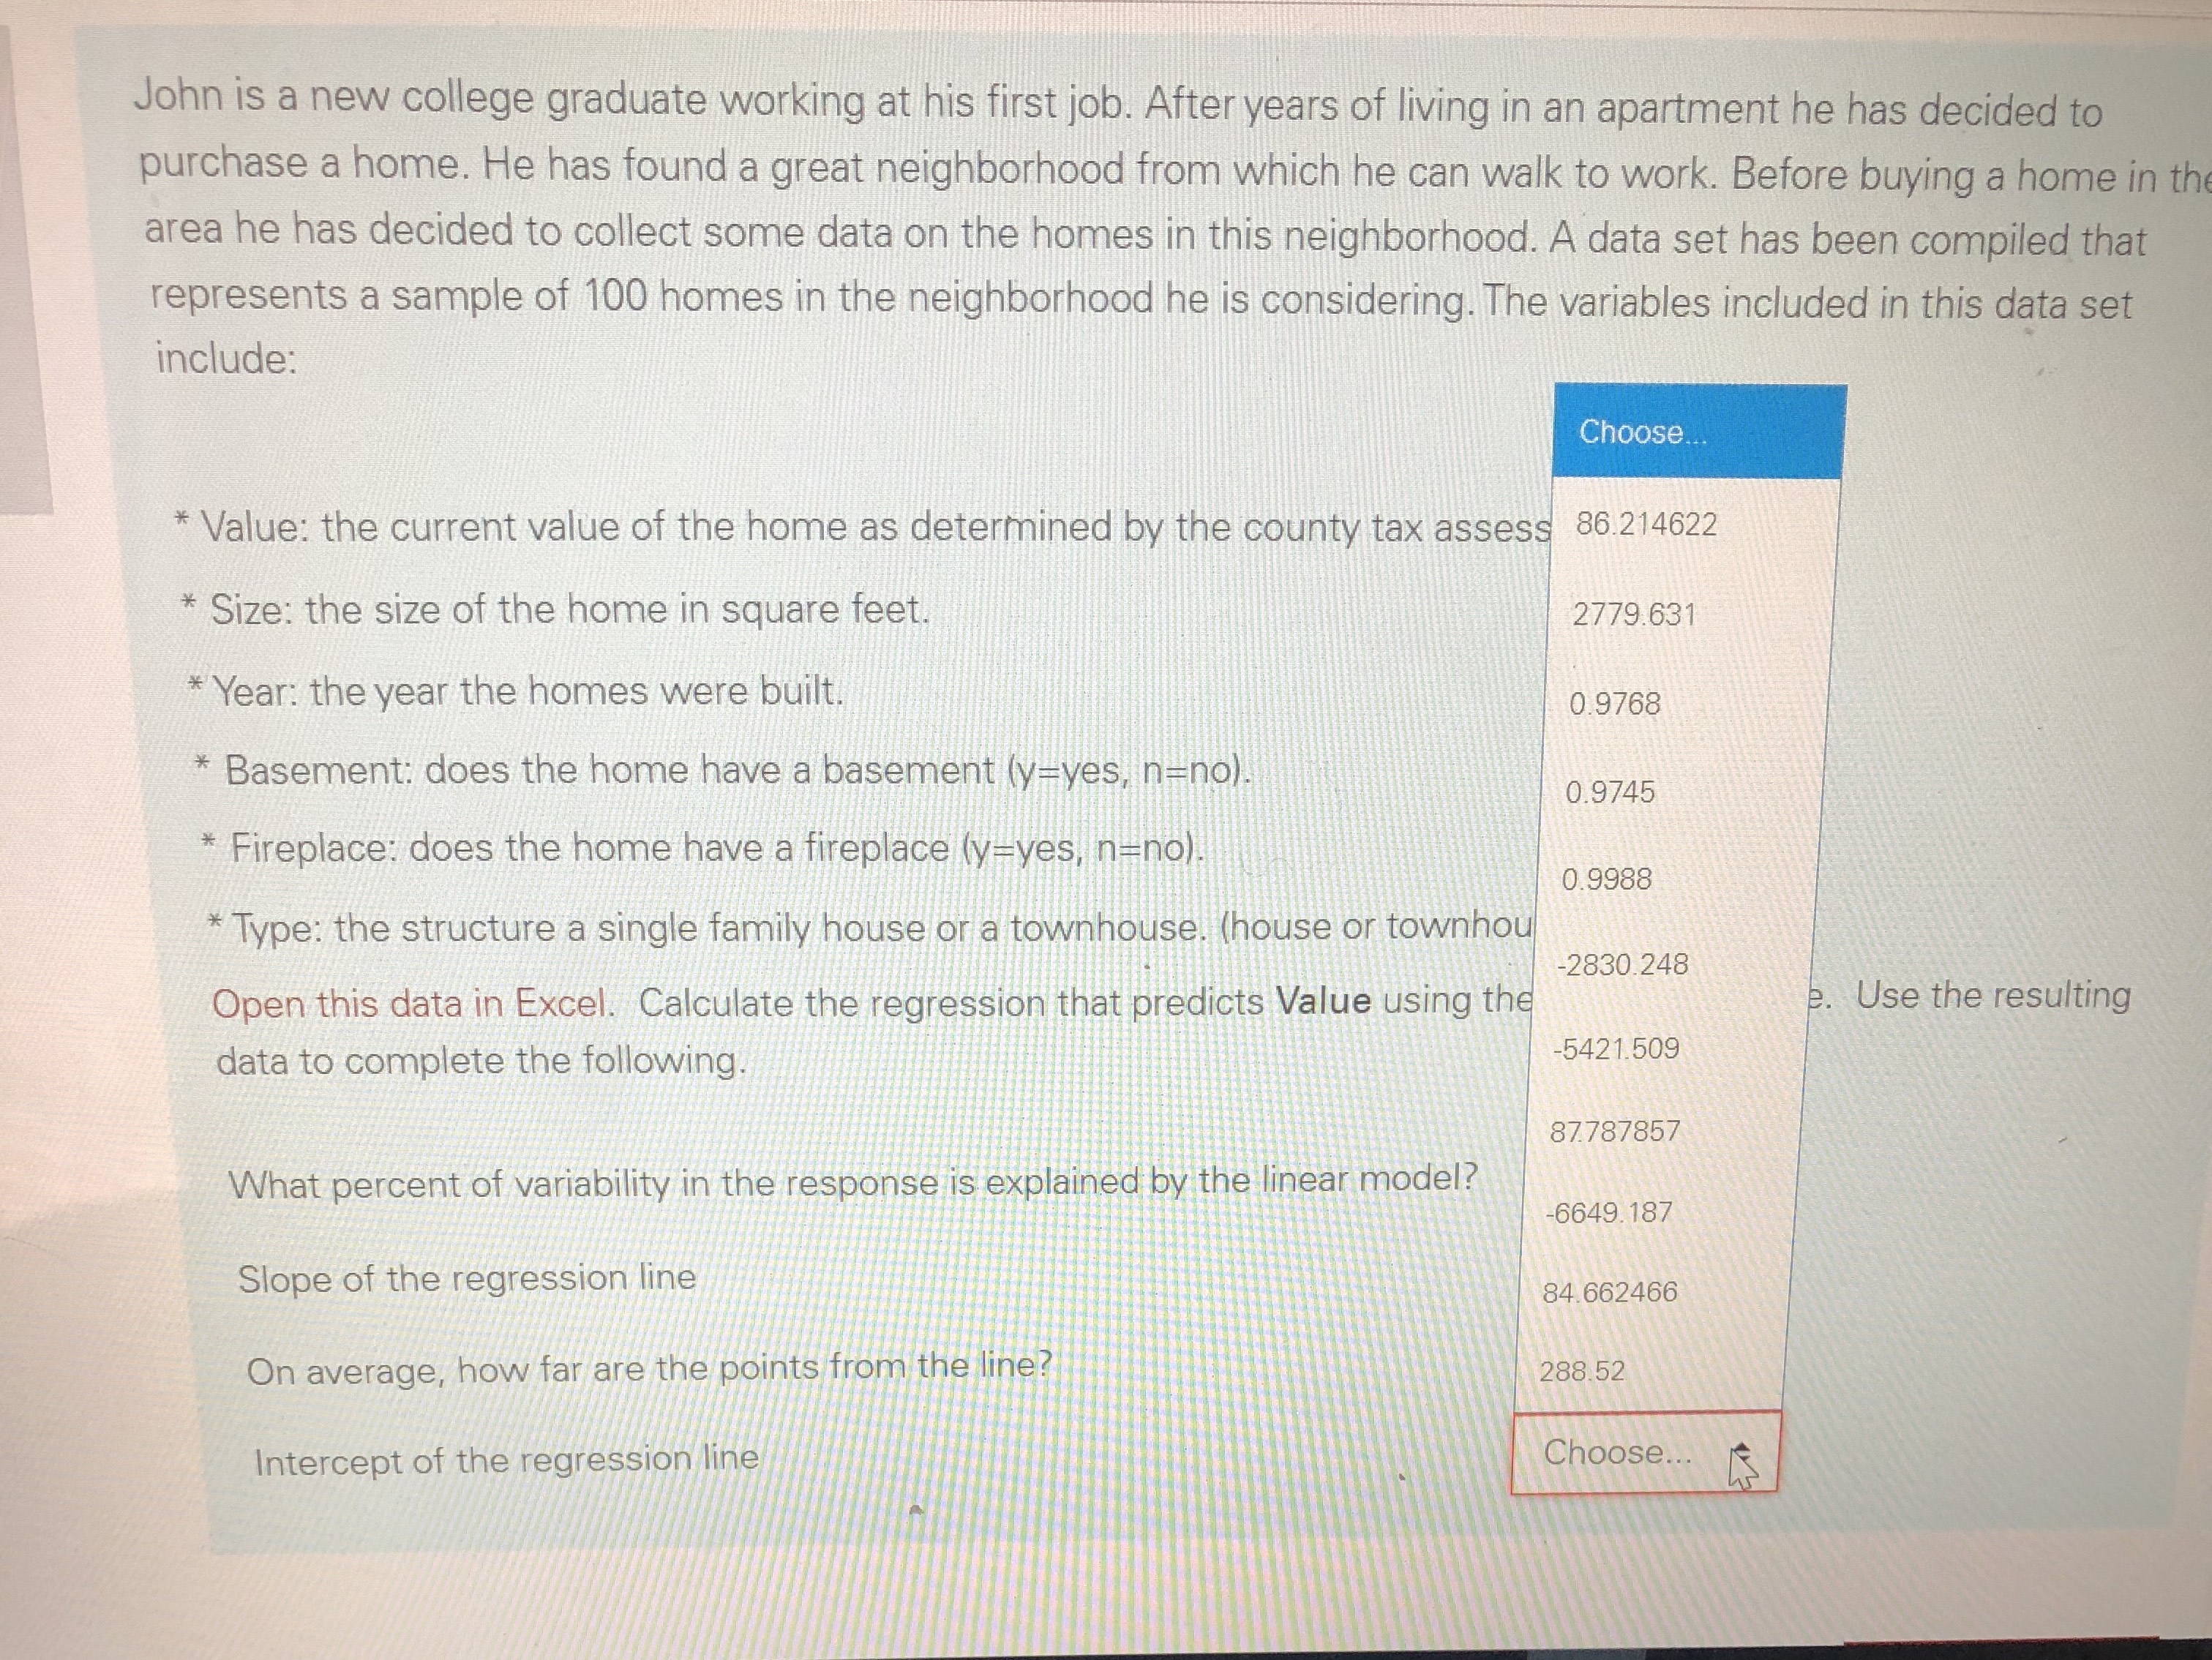
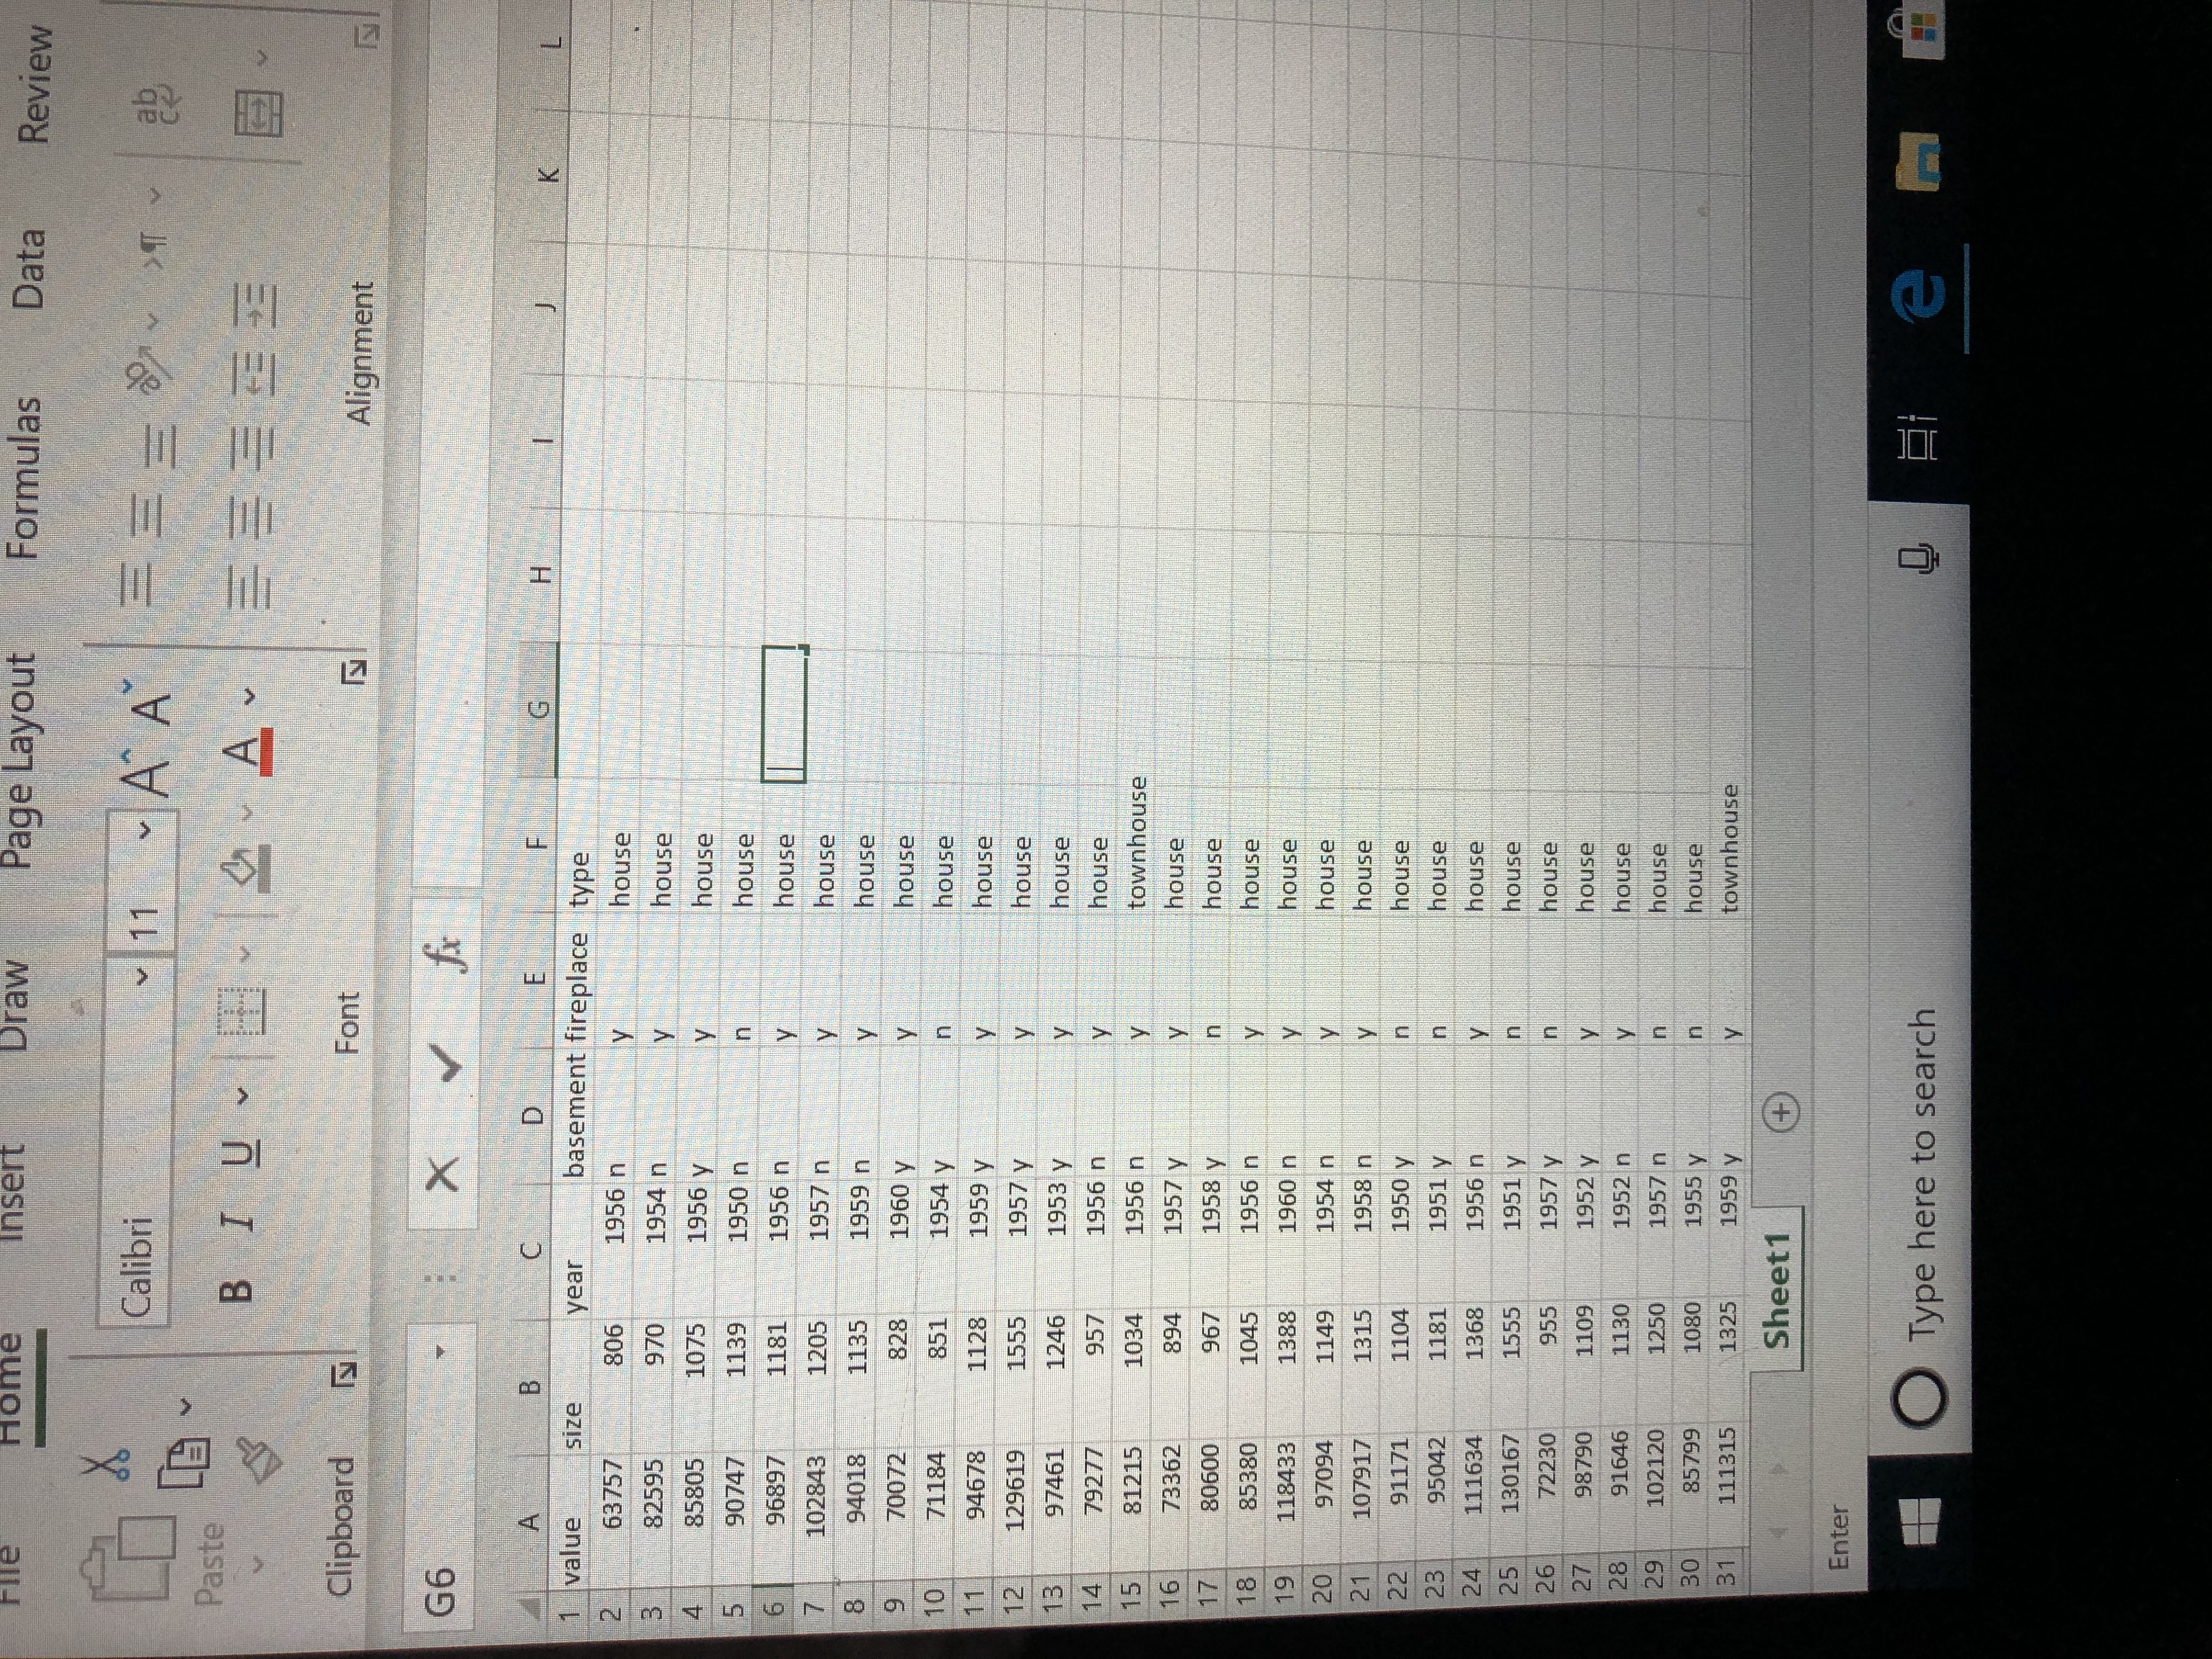
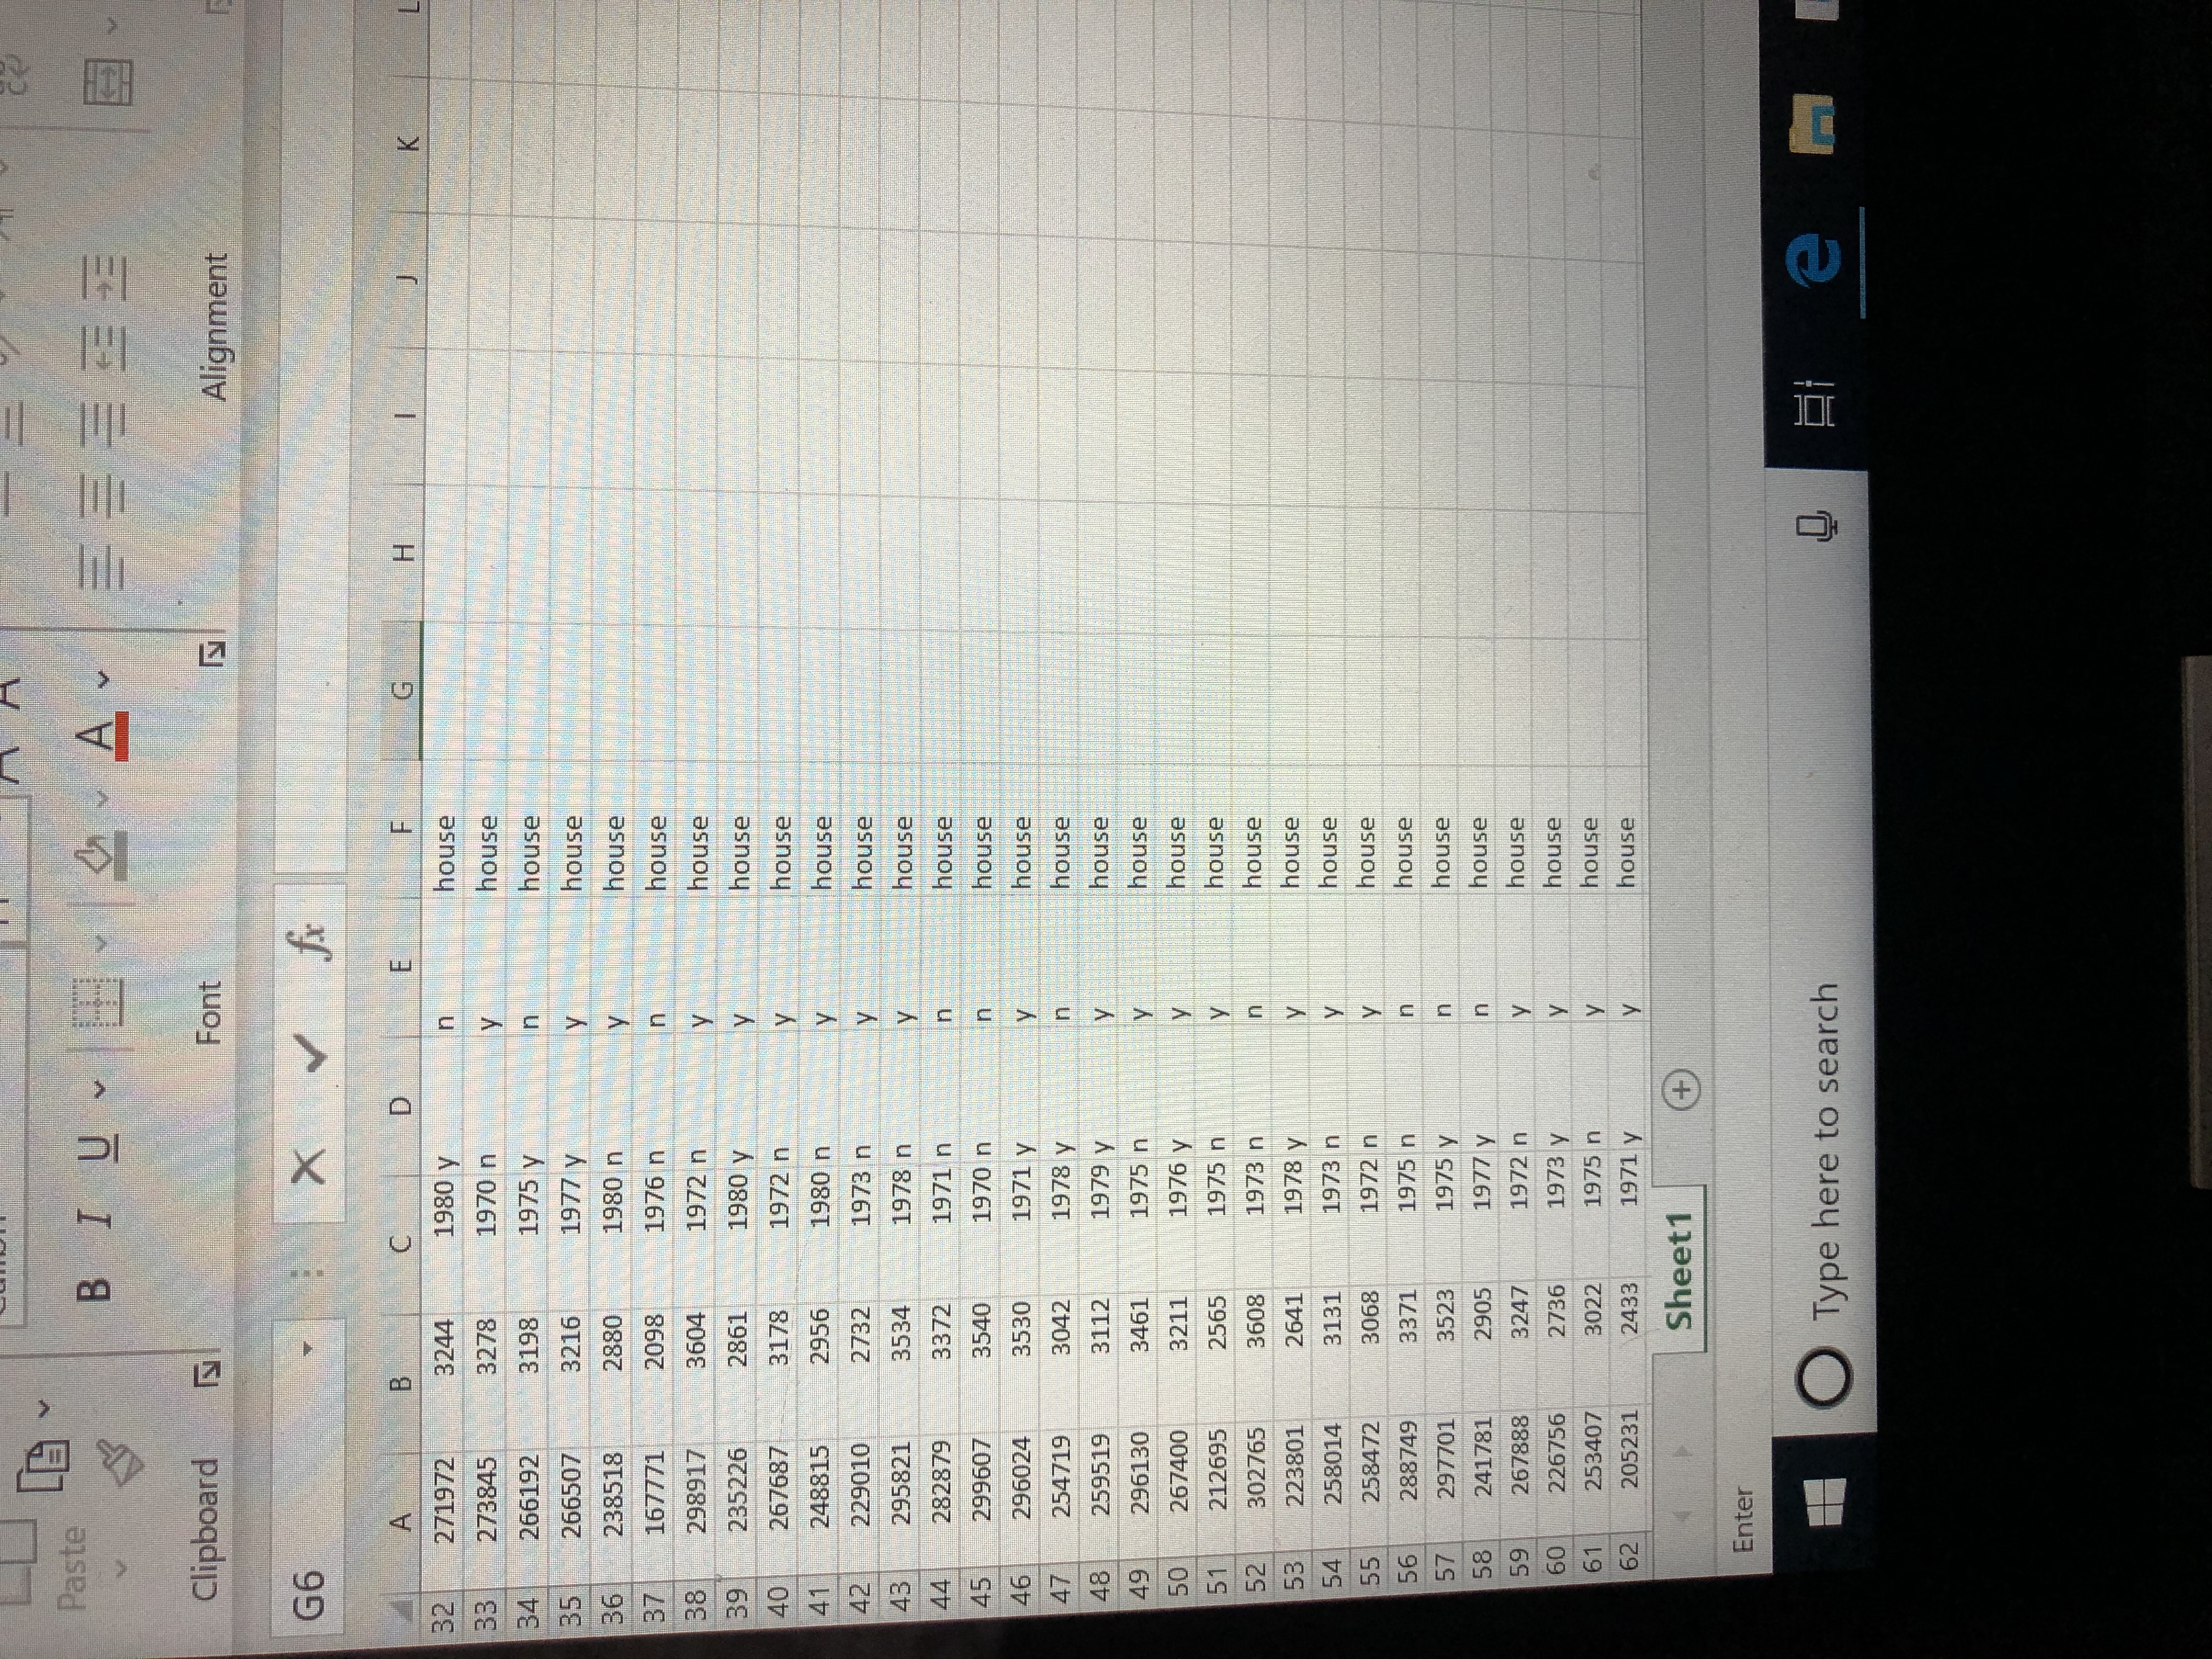
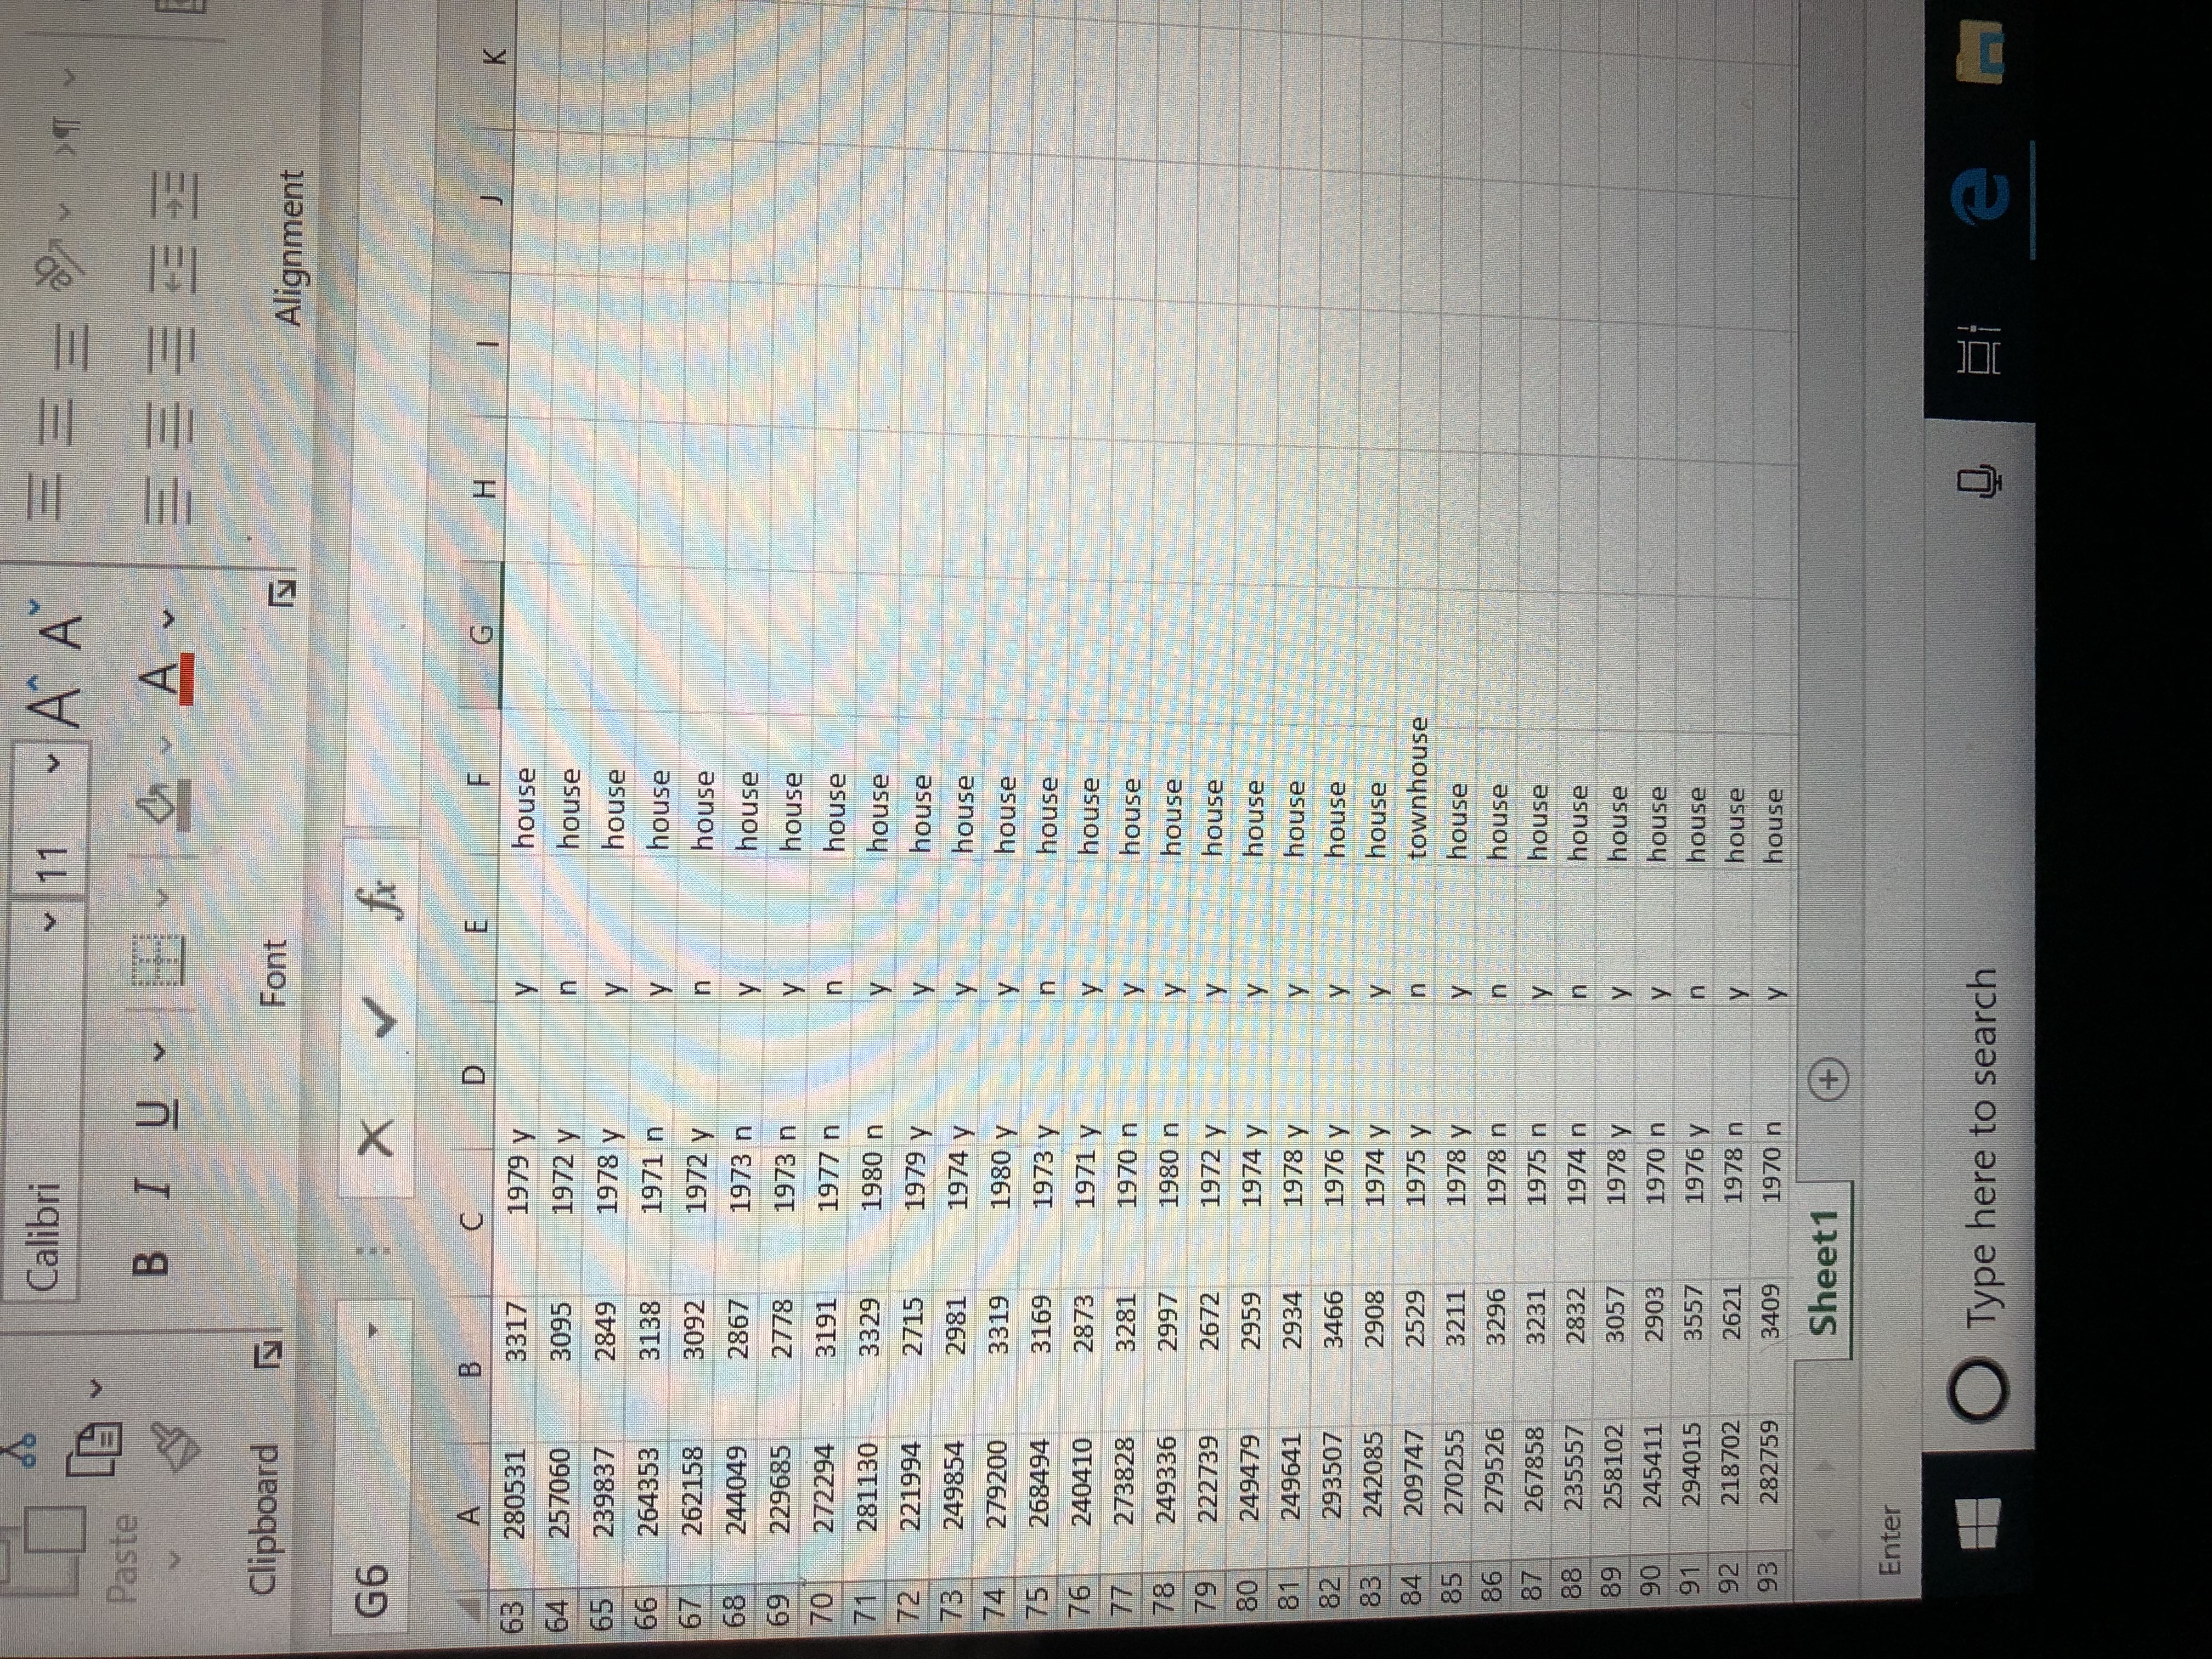
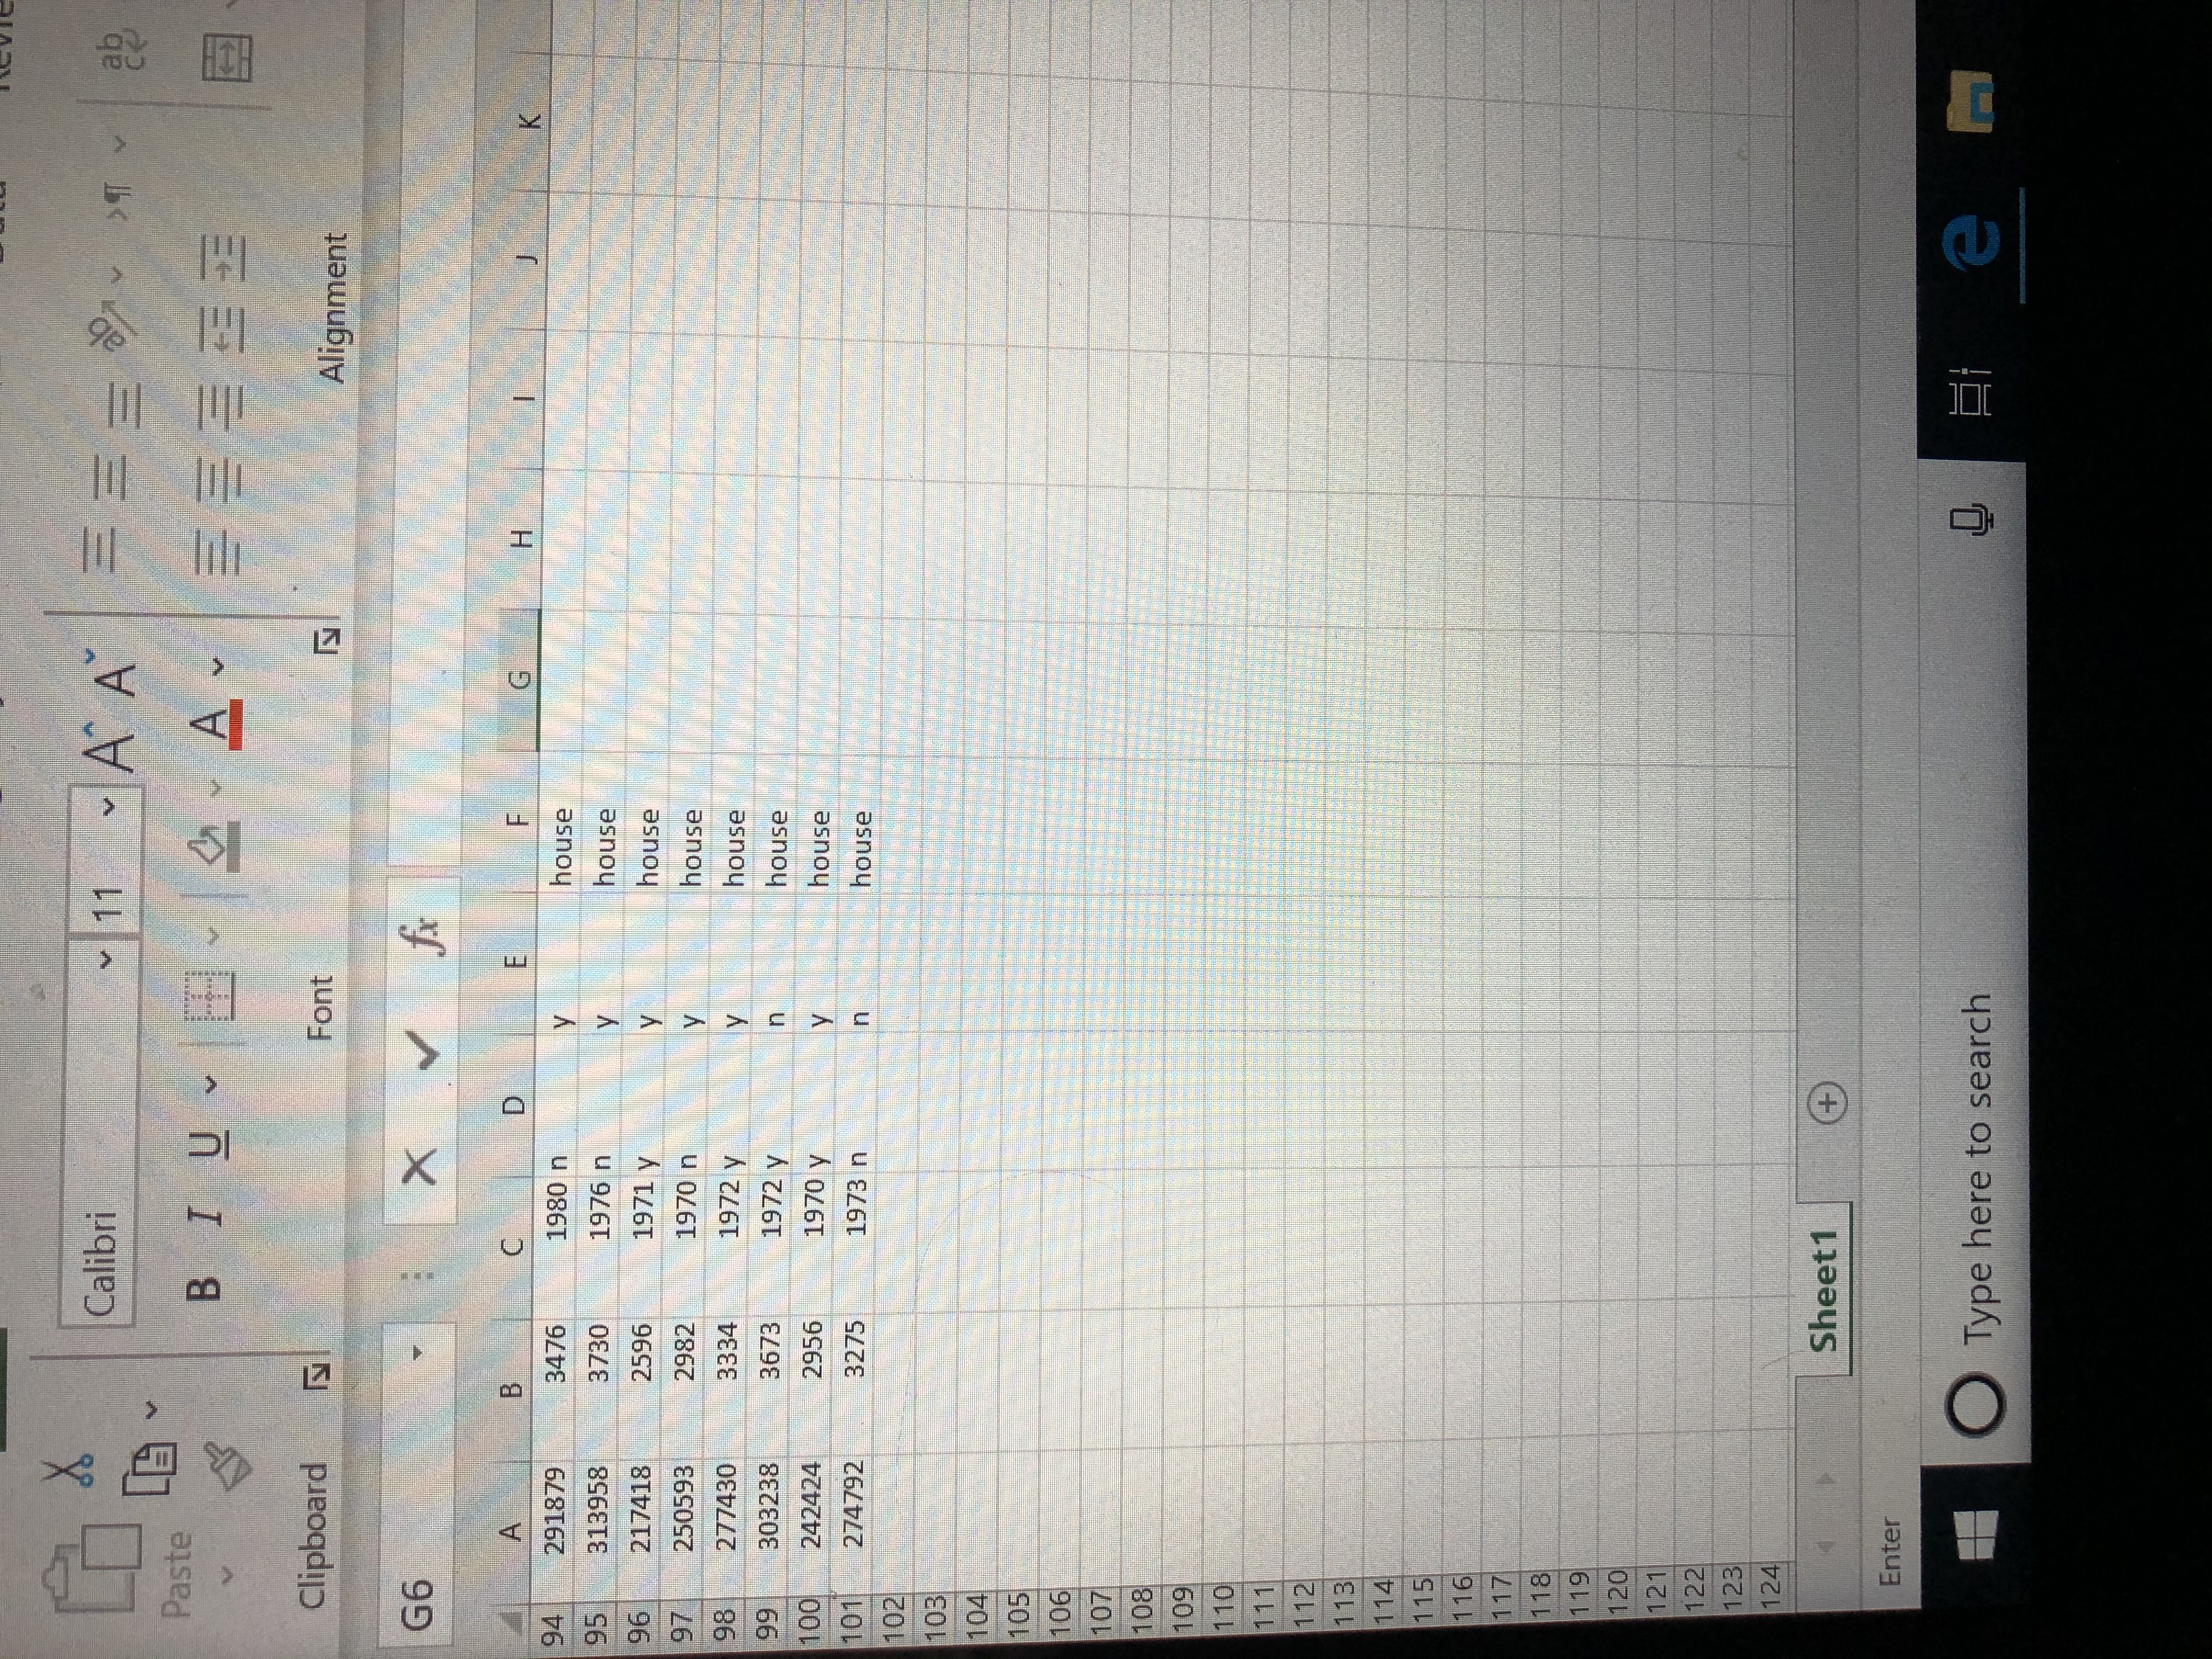
John is a new college graduate working at his first job. After years of living in an apartment he has decided to purchase a home. He has found a great neighborhood from which he can walk to work. Before buying a home in the area he has decided to collect some data on the homes in this neighborhood. A data set has been compiled that represents a sample of 100 homes in the neighborhood he is considering. The variables included in this data set include: * Value: the current value of the home as determined by the county tax assessor. * Size: the size of the home in square feet. * Year: the year the homes were built. * Basement: does the home have a basement (y-yes, n=no) * Fireplace: does the home have a fireplace (y=yes, n=no) * Type: the structure a single family house or a townhouse. (house or townhouse). Open this data in Excel. Calculate the regression that predicts Value using the size of the home. Use the resulting data to complete the followingJohn is a new college graduate working at his first job. After years of living in an apartment he has decided to purchase a home. He has found a great neighborhood from which he can walk to work. Before buying a home in the area he has decided to collect some data on the homes in this neighborhood. A data set has been compiled that represents a sample of 100 homes in the neighborhood he is considering. The variables included in this data set include: * Value: the current value of the home as determined by the county tax assessor. * Size: the size of the home in square feet. * Year: the year the homes were built. * Basement: does the home have a basement (y=yes, n=no). * Fireplace: does the home have a fireplace (y=yes, n=no). * Type: the structure a single family house or a townhouse. (house or townhouse). Open this data in Excel. Calculate the regression that predicts Value using the size of the home. Use the resulting data to complete the following. What percent of variability in the response is explained by the linear model? Choose... Slope of the regression line Choose... On average, how far are the points from the line? Choose... Intercept of the regression line Choose...John is a new college graduate working at his first job. After years of living in an apartment he has decided to purchase a home. He has found a great neighborhood from which he can walk to work. Before buying a home in th area he has decided to collect some data on the homes in this neighborhood. A data set has been compiled that represents a sample of 100 homes in the neighborhood he is considering. The variables included in this data set include: Choose. * Value: the current value of the home as determined by the county tax assess 86.214622 * Size: the size of the home in square feet. 2779.631 * Year: the year the homes were built. 0.9768 * Basement: does the home have a basement (y=yes, n=no) 0.9745 * Fireplace: does the home have a fireplace (y=yes, n=no). 0.9988 * Type: the structure a single family house or a townhouse. (house or townhou -2830.248 Open this data in Excel. Calculate the regression that predicts Value using the e. Use the resulting data to complete the following. -5421.509 87.787857 What percent of variability in the response is explained by the linear model? -6649. 187 Slope of the regression line 84.662466 On average, how far are the points from the line? 288.52 Intercept of the regression line Choose...Home insert Draw Page Layout Formulas Data Review Calibri 11 AA ap Paste B I U A Clipboard Font Alignment G6 X V fx C 1 value size year basement fireplace type 2 63757 306 1956 n house 82595 970 1954 n house 4 85805 1075 1956 y house 15 90747 1139 1950 n house 96897 1181 1956 n house 102843 1205 1957 n house 94018 1135 1959 n house 70072 828 1960 house 10 71184 851 1954 y n house 11 94678 1128 1959 y house 12 129619 1555 1957 house 13 97461 1246 1953 y house 14 79277 957 1956 n house 15 81215 1034 1956 n townhouse 16 73362 894 1957 y house 17 80600 967 1958 y 15 house 18 85380 1045 1956 n house 19 118433 1388 1960 n house 20 97094 1149 1954 n house 21 107917 1315 1958 n house 22 91171 1104 1950 y house 23 95042 1181 1951 y house 24 111634 1368 1956 n house 25 130167 1555 1951 y house 26 72230 955 1957 y house 27 98790 1109 1952 y house 28 91646 1130 1952 n house 29 102120 1250 1957 n house 85799 1080 1955 y house 31 111315 1325 1959 y townhouse Sheet 1 (+ Enter Type here to search e mce Paste BIU v Clipboard IN Font Alignment G6 X V fix B D F G H 32 271972 3244 1980 y n house 33 273845 3278 1970 n house 34 266192 3198 1975 y In house 35 266507 3216 1977 y house 36 238518 2880 1980 n house 37 167771 2098 1976 n house 38 298917 3604 1972 n house 39 235226 2861 1980 y house 40 267687 3178 1972 n y house 41 248815 2956 1980 n house 42 229010 2732 1973 n Y house 43 295821 3534 1978 n house 44 282879 3372 1971 n n house 45 299607 3540 1970 n house 46 296024 3530 1971 y house 47 254719 3042 1978 y in house 48 259519 3112 1979 y house 49 296130 3461 1975 n house 50 267400 3211 1976 y house 51 212695 2565 1975 n house 52 302765 3608 1973 n house 53 223801 2641 1978 y house 54 258014 3131 1973 n house 55 258472 3068 1972 n house 56 288749 3371 1975 n house 57 297701 3523 1975 y house 58 241781 2905 1977 y house 59 267888 3247 1972 n house 60 226756 2736 1973 y house 61 253407 3022 1975 n house 62 205231 2433 1971 y house Sheet1 + Enter Type here to search eCalibri 11 A A Paste LA BIUV A Clipboard N Font Alignment G6 X V fix A B C D E G H K 63 280531 3317 1979 y house 64 257060 3095 1972 y n house 65 239837 2849 1978 y house 66 264353 3138 1971 n house 67 262158 3092 1972 y n house 68 244049 2867 1973 n y house 69 229685 2778 1973 n house 70 272294 3191 1977 n n house 71 281130 3329 1980 n house 72 221994 2715 1979 y y house 73 249854 2981 1974 y house 74 279200 3319 1980 house 75 268494 3169 1973 y house 76 240410 2873 1971 y house 77 273828 281 1970 n house 78 249336 2997 1980 n house 79 222739 2672 1972 \\ house 80 249479 2959 1974 y house 81 249641 2934 1978 y house 82 293507 3466 1976 y house 83 242085 2908 1974 y house 84 209747 2529 1975 y townhouse 85 270255 3211 1978 y house 86 279526 3296 1978 n house 87 267858 3231 1975 n house 88 235557 2832 1974 n house 89 258102 3057 1978 y house 90 245411 2903 1970 n house 91 294015 3557 1976 y house 92 218702 2621 1978 n house 93 282759 3409 1970 n house Sheet1 (+) Enter O Type here to search eCalibri 11 AA Paste B I UV A Clipboard Font Alignment G6 X V A B C D G H 94 291879 3476 1980 n house 95 313958 3730 1976 n house 96 217418 2596 1971 y house 97 250593 2982 1970 n house 98 277430 3334 1972 y house 99 303238 3673 1972 y n house 100 242424 2956 1970 y house 101 274792 3275 1973 n house 102 103 104 105 106 107 108 109 1 10 111 112 113 114 1 15 116 117 118 119 120 121 122 123 124 Sheet1 + Enter O Type here to search e
Step by Step Solution
There are 3 Steps involved in it

Get step-by-step solutions from verified subject matter experts