

Question: how do i code for this in R studio? Influential Observations > influence measures (model) Influence measures of Im formula - Days Protein + Antibiotic
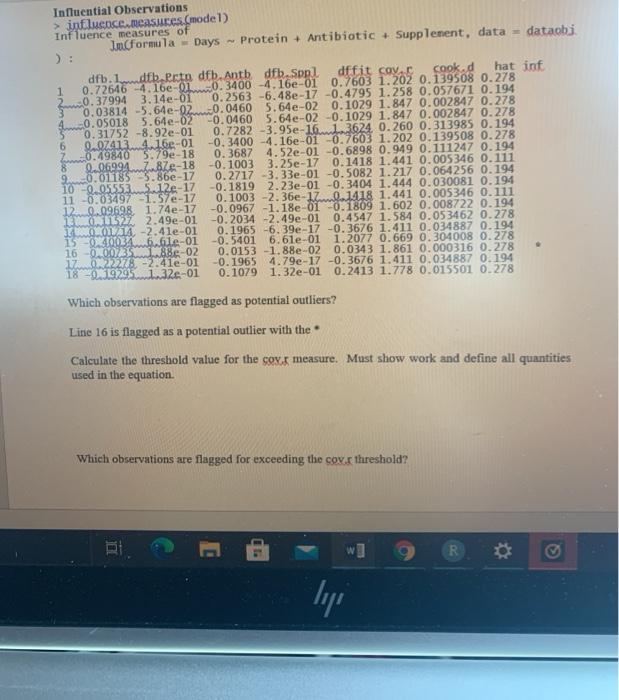
Influential Observations > influence measures (model) Influence measures of Im formula - Days Protein + Antibiotic + Supplement, data = dataobj dfb.dfb.erta dfb. Antb dfb Sopldffit cay c cook.d hat inf 1 0.72646 4.166-01-0.3400 -4.16e-01 0.7603 1.202 0.139508 0.278 0.37994 3.14e-01 0.2563 -6.48e-17 -0.4795 1.258 0.057671 0.194 3 0.03814 -5.64e-020.0460 5.64e-02 0.1029 1.847 0.002847 0.278 -0.05018 5.64e-02 -0.0460 5.64e-02 -0.1029 1.847 0.002847 0.278 5 0.31752 -8.92e-01 0.7282 -3.95e-16.1.3624 0.260 0.313985 0.194 6 0.07413.4.16e-01 -0.3400 -4.16e-01 -0.7603 1.202 0.139508 0.278 0.49840 5.79e-18 0.3687 4.52e-01 -0.6898 0.949 0.111247 0.194 8 0.06994876-18 -0.1003 3.25e-17 0.1418 1.441 0.005346 0.111 90.011855.86e-17 0.2717 -3.33e-01 -0.5082 1.217 0.064256 0.194 100_055535.12e-17 -0.1819 2.23e-01 -0.3404 1.444 0.030081 0.194 11 -0.03497 -1.574-17 0.1003 -2.36e- 1.1418 1.441 0.005346 0.111 12. 0.09698 1.74e-17 -0.0967 -1.18e-01 -0.1809 1.602 0.008722 0.194 $1.27 2.49e-01 -0.2034 -2.49e-01 0.4547 1.584 0.053462 0.278 CHOWA -2.4le-01 0.1965 -6.39e-17 -0.3676 1.411 0.034887 0.194 15 02.20034.5.61e-01 -0.5401 6.61e-01 1.2077 0.669 0.304008 0.278 16 0.0073886-02 0.0153 -1.88e-02 0.0343 1.861 0.000316 0.278 17022278 -2.41e-01 -0.1965 4.79e-17 -0.3676 1.411 0.034887 0.194 18 -0.1929.32e-01 0.1079 1.32e-01 0.2413 1.778 0.015501 0.278 Which observations are flagged as potential outliers? Line 16 is flagged as a potential outlier with the Calculate the threshold value for the cox measure. Must show work and define all quantities used in the equation Which observations are flagged for exceeding the cow. threshold? R * liji Influential Observations > influence measures (model) Influence measures of Im formula - Days Protein + Antibiotic + Supplement, data = dataobj dfb.dfb.erta dfb. Antb dfb Sopldffit cay c cook.d hat inf 1 0.72646 4.166-01-0.3400 -4.16e-01 0.7603 1.202 0.139508 0.278 0.37994 3.14e-01 0.2563 -6.48e-17 -0.4795 1.258 0.057671 0.194 3 0.03814 -5.64e-020.0460 5.64e-02 0.1029 1.847 0.002847 0.278 -0.05018 5.64e-02 -0.0460 5.64e-02 -0.1029 1.847 0.002847 0.278 5 0.31752 -8.92e-01 0.7282 -3.95e-16.1.3624 0.260 0.313985 0.194 6 0.07413.4.16e-01 -0.3400 -4.16e-01 -0.7603 1.202 0.139508 0.278 0.49840 5.79e-18 0.3687 4.52e-01 -0.6898 0.949 0.111247 0.194 8 0.06994876-18 -0.1003 3.25e-17 0.1418 1.441 0.005346 0.111 90.011855.86e-17 0.2717 -3.33e-01 -0.5082 1.217 0.064256 0.194 100_055535.12e-17 -0.1819 2.23e-01 -0.3404 1.444 0.030081 0.194 11 -0.03497 -1.574-17 0.1003 -2.36e- 1.1418 1.441 0.005346 0.111 12. 0.09698 1.74e-17 -0.0967 -1.18e-01 -0.1809 1.602 0.008722 0.194 $1.27 2.49e-01 -0.2034 -2.49e-01 0.4547 1.584 0.053462 0.278 CHOWA -2.4le-01 0.1965 -6.39e-17 -0.3676 1.411 0.034887 0.194 15 02.20034.5.61e-01 -0.5401 6.61e-01 1.2077 0.669 0.304008 0.278 16 0.0073886-02 0.0153 -1.88e-02 0.0343 1.861 0.000316 0.278 17022278 -2.41e-01 -0.1965 4.79e-17 -0.3676 1.411 0.034887 0.194 18 -0.1929.32e-01 0.1079 1.32e-01 0.2413 1.778 0.015501 0.278 Which observations are flagged as potential outliers? Line 16 is flagged as a potential outlier with the Calculate the threshold value for the cox measure. Must show work and define all quantities used in the equation Which observations are flagged for exceeding the cow. threshold? R * liji
Step by Step Solution
There are 3 Steps involved in it

Get step-by-step solutions from verified subject matter experts