

Question: How do I compare/contrast the histogram and tables using proper statistical language? What information stands out based on the comparison? Anything interesting or unusual? tIs
How do I compare/contrast the histogram and tables using proper statistical language? What information stands out based on the comparison? Anything interesting or unusual? tIs the trend in data as expected? Expand on findings.
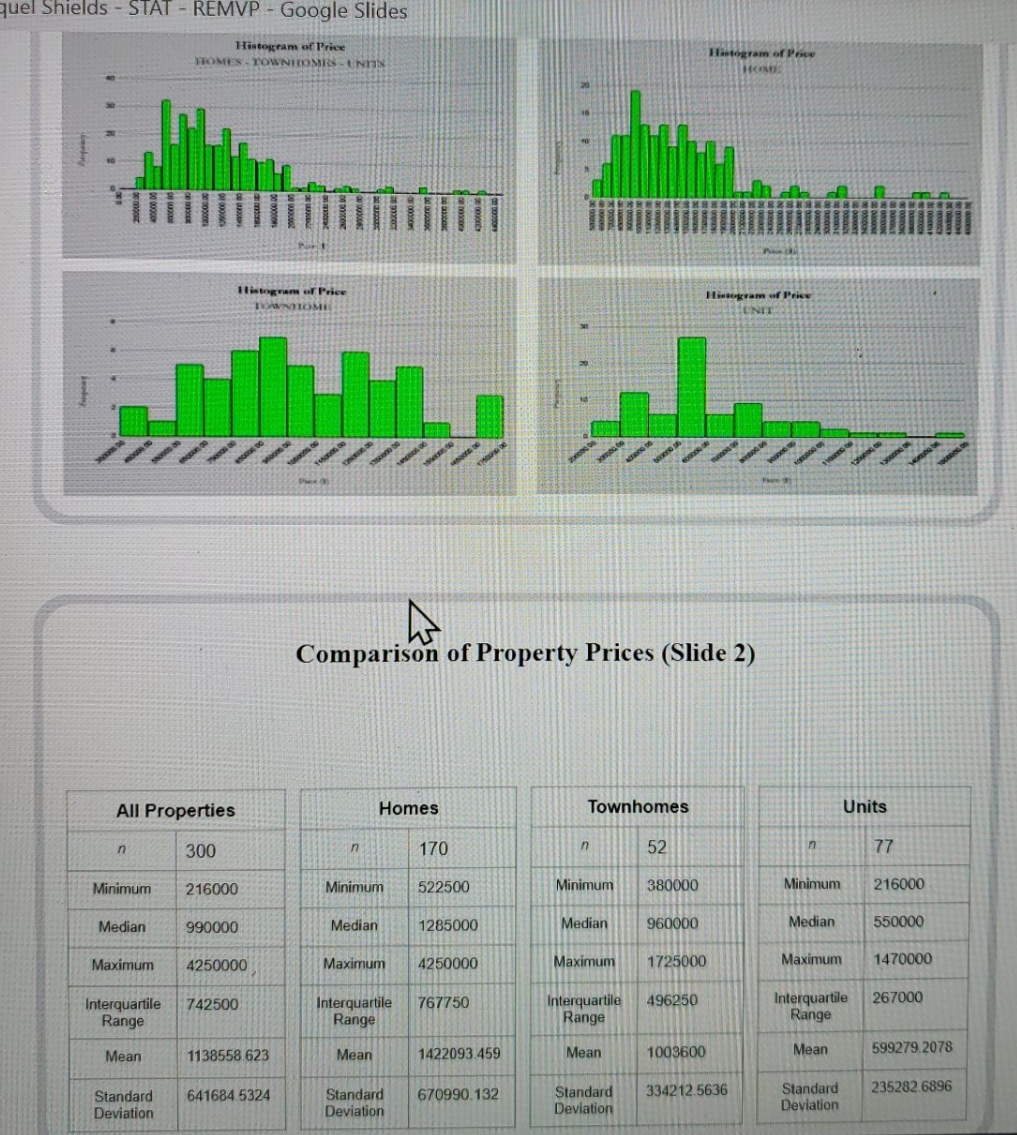
quel Shields - STAT - REMVP - Google Slides Histogram of Price Histogram of Price HOMES - TOWNHOMES - UNITS Histogram of Price Histogram of Price TOWNTOMI Comparison of Property Prices (Slide 2) All Properties Homes Townhomes Units 300 170 52 77 Minimum 216000 Minimum 522500 Minimum 380000 Minimum 216000 Median 990000 Median 1285000 Median 960000 Median 550000 Maximum 4250000 Maximum 4250000 Maximum 1725000 Maximum 1470000 Interquartile 742500 Interquartile 767750 Interquartile 496250 Interquartile 267000 Range Range Range Range Mean 1138558.623 Mean 1422093.459 Mean 1003600 Mean 599279.2078 Standard 641684.5324 Standard 670990.132 Standard 334212.5636 Standard 235282.6896 Deviation Deviation Deviation Deviation
Step by Step Solution
There are 3 Steps involved in it

Get step-by-step solutions from verified subject matter experts