

Question: How do I complete the formula for the yellow box? Income quintile Bottom Second Middle Fourth Top Total 8000 7200 4500 2300 3000 25000 120000
How do I complete the formula for the yellow box?
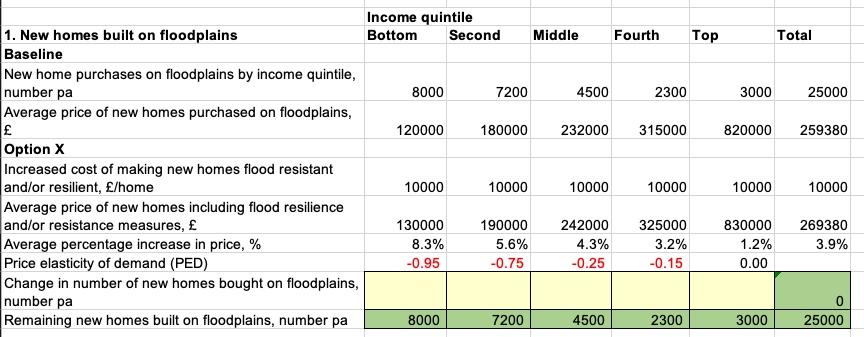
Income quintile Bottom Second Middle Fourth Top Total 8000 7200 4500 2300 3000 25000 120000 180000 232000 315000 820000 259380 1. New homes built on floodplains Baseline New home purchases on floodplains by income quintile, number pa Average price of new homes purchased on floodplains, Option X Increased cost of making new homes flood resistant and/or resilient, /home Average price of new homes including flood resilience and/or resistance measures, Average percentage increase in price, % Price elasticity of demand (PED) Change in number of new homes bought on floodplains, number pa Remaining new homes built on floodplains, number pa 10000 10000 10000 10000 10000 10000 130000 8.3% -0.95 190000 5.6% -0.75 242000 4.3% -0.25 325000 3.2% -0.15 830000 1.2% 0.00 269380 3.9% 0 25000 8000 7200 4500 2300 3000
Step by Step Solution
There are 3 Steps involved in it

Get step-by-step solutions from verified subject matter experts