

Question: How do I complete the ratios chart based on the information below? Please show all math work Dayne 2013 Wholesale 2009 Good Values Current: >2
How do I complete the ratios chart based on the information below? Please show all math work
| Dayne 2013 | Wholesale 2009 | Good Values | |
| Current: |
|
| >2 |
| Quick: |
|
| >1 |
| GP: |
|
| >10% |
| Debt: |
|
|
|
| Debt:Equity |
|
|
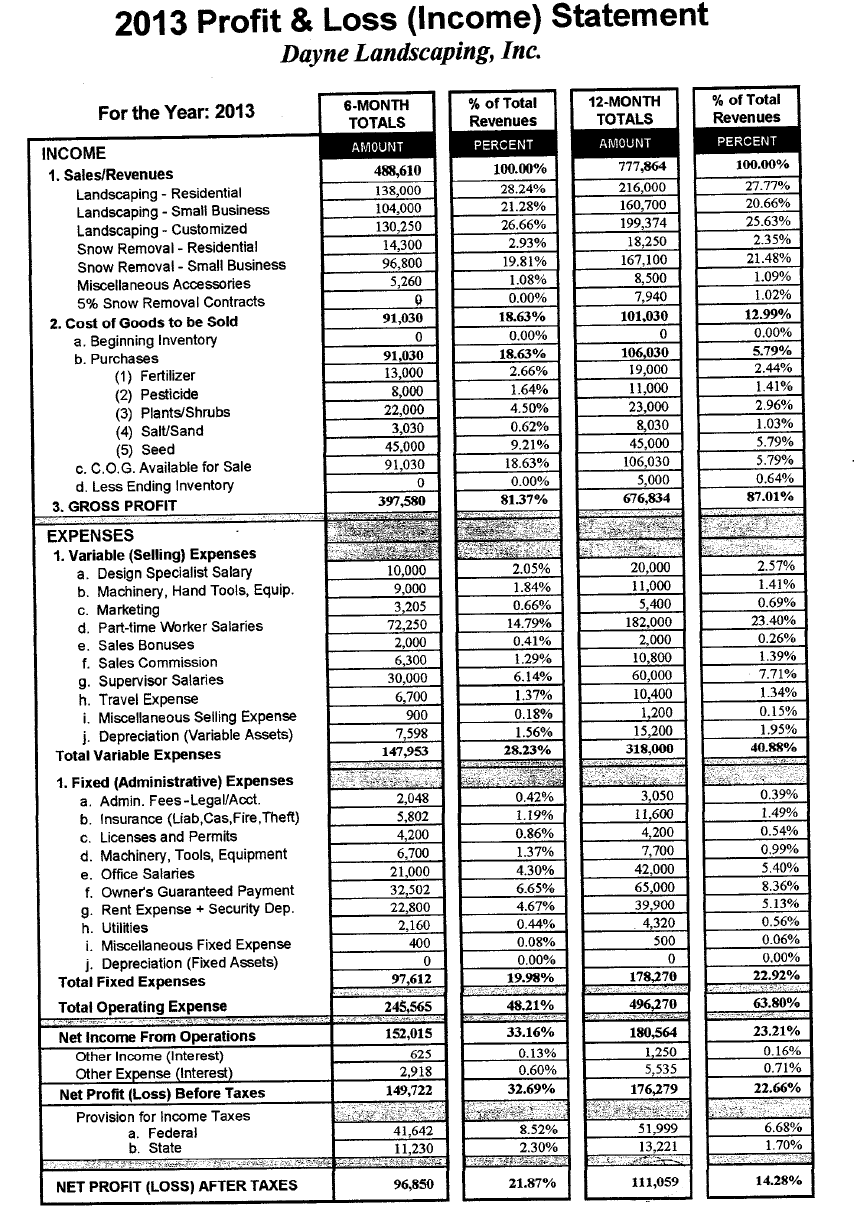
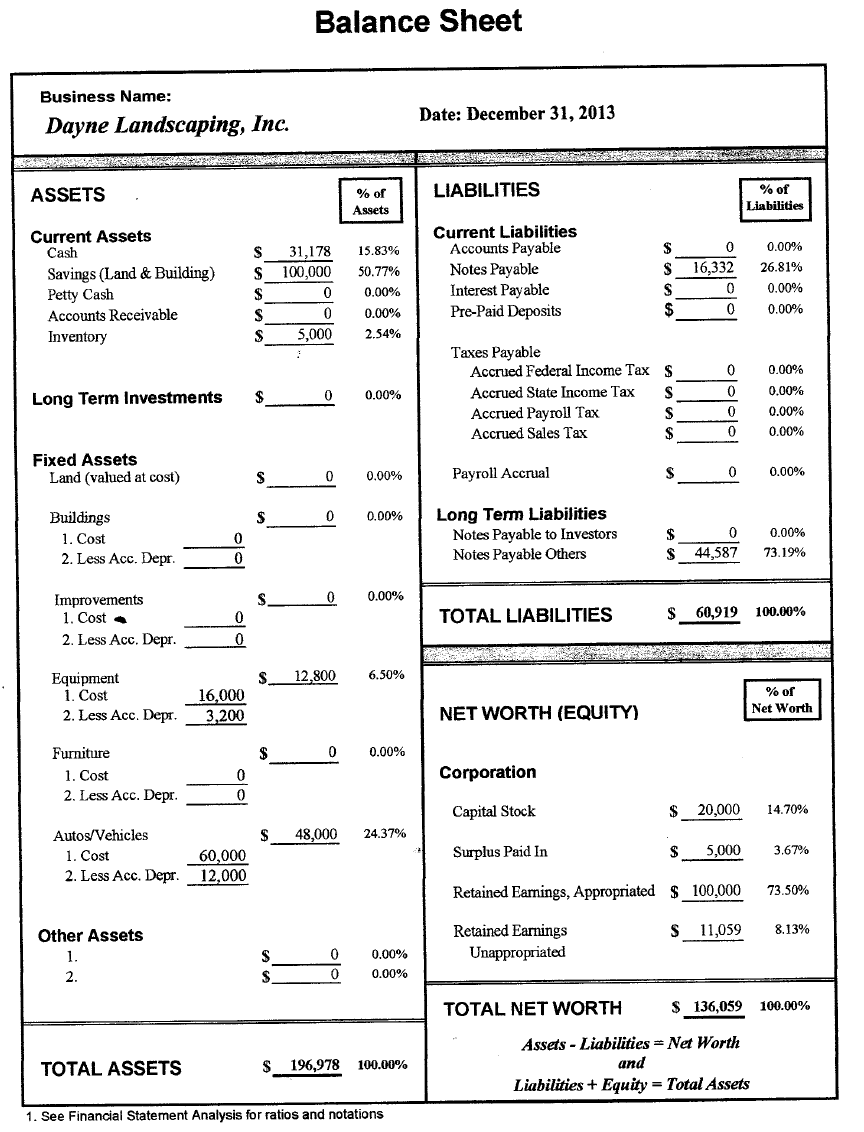
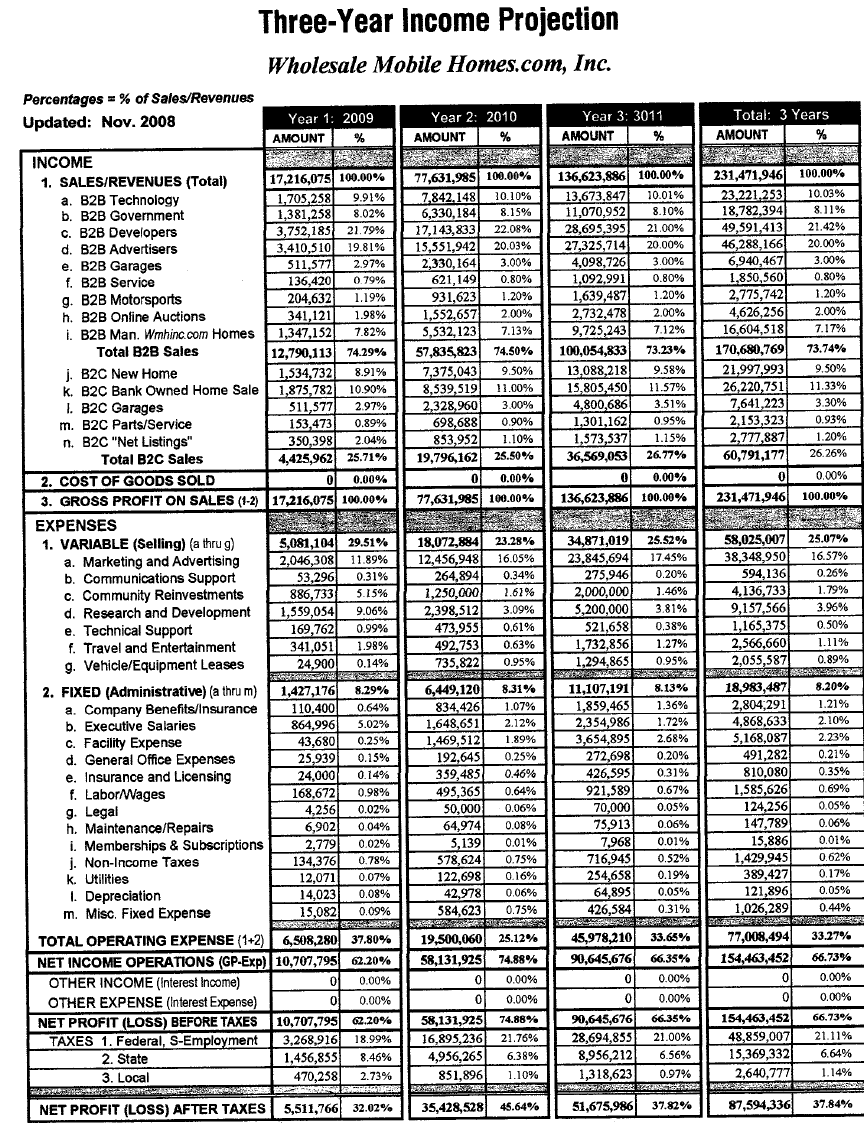
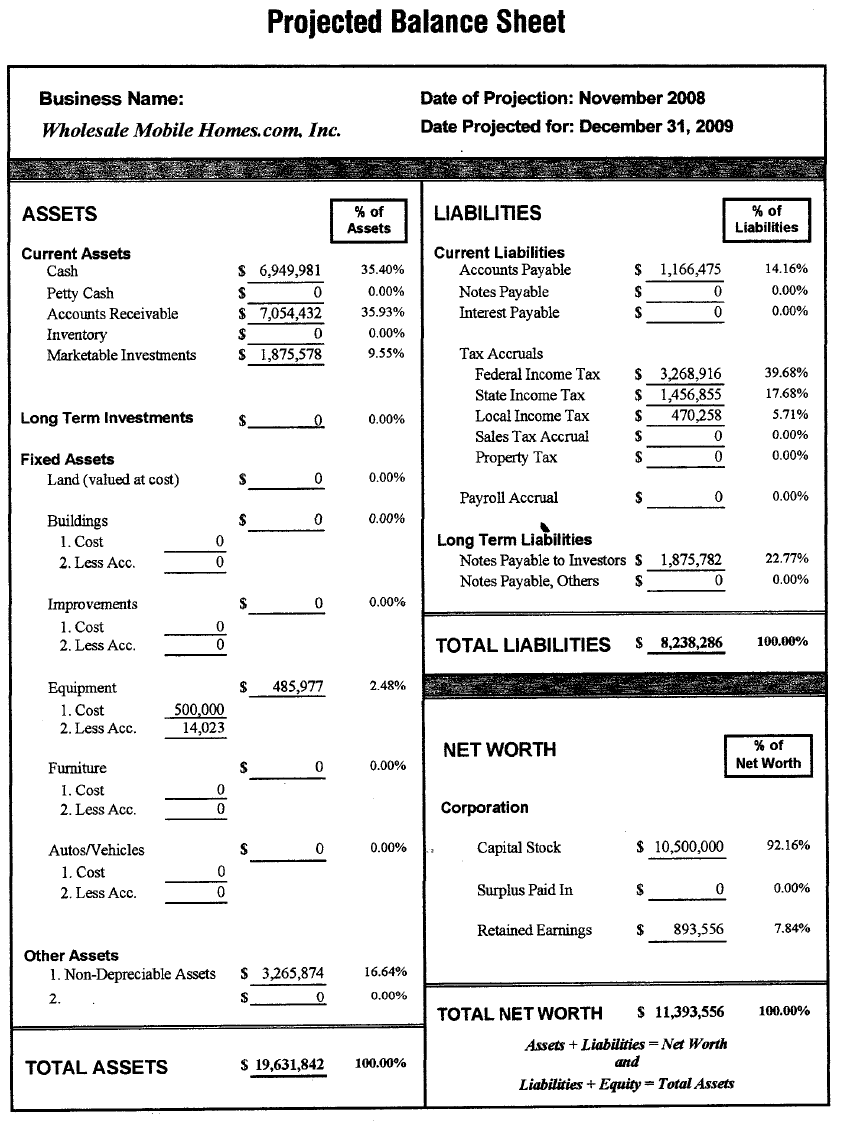
2013 Profit \& Loss (Income) Statement Balance Sheet Three-Year Income Projection Wholesale Mobile Homes.com, Inc. Projected Balance Sheet
Step by Step Solution
There are 3 Steps involved in it
1 Expert Approved Answer
Step: 1 Unlock

Question Has Been Solved by an Expert!
Get step-by-step solutions from verified subject matter experts
Step: 2 Unlock
Step: 3 Unlock