

Question: How do i correct my MATLAB Code to work and produce a graph with this image: desired plot: MATLAB CODE: student ID number. Does the
How do i correct my MATLAB Code to work and produce a graph with this image:
desired plot:
MATLAB CODE:
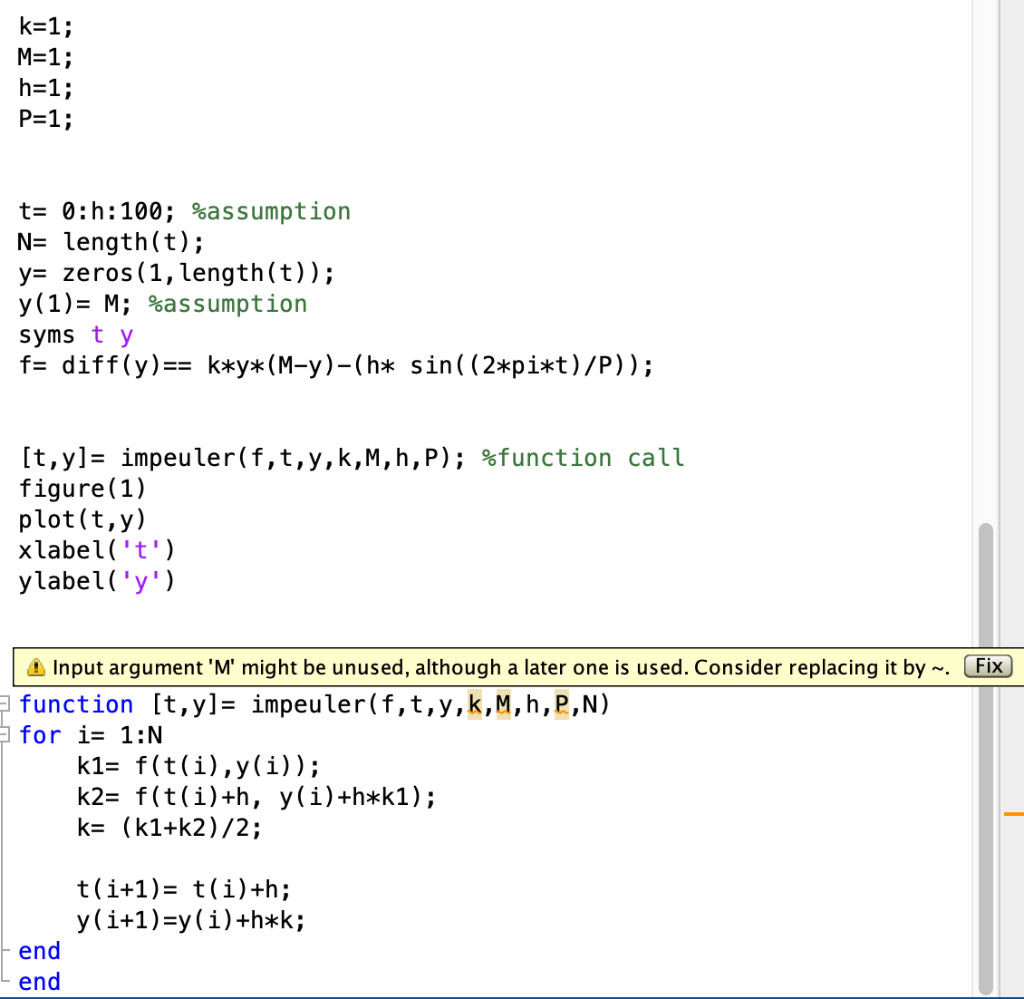

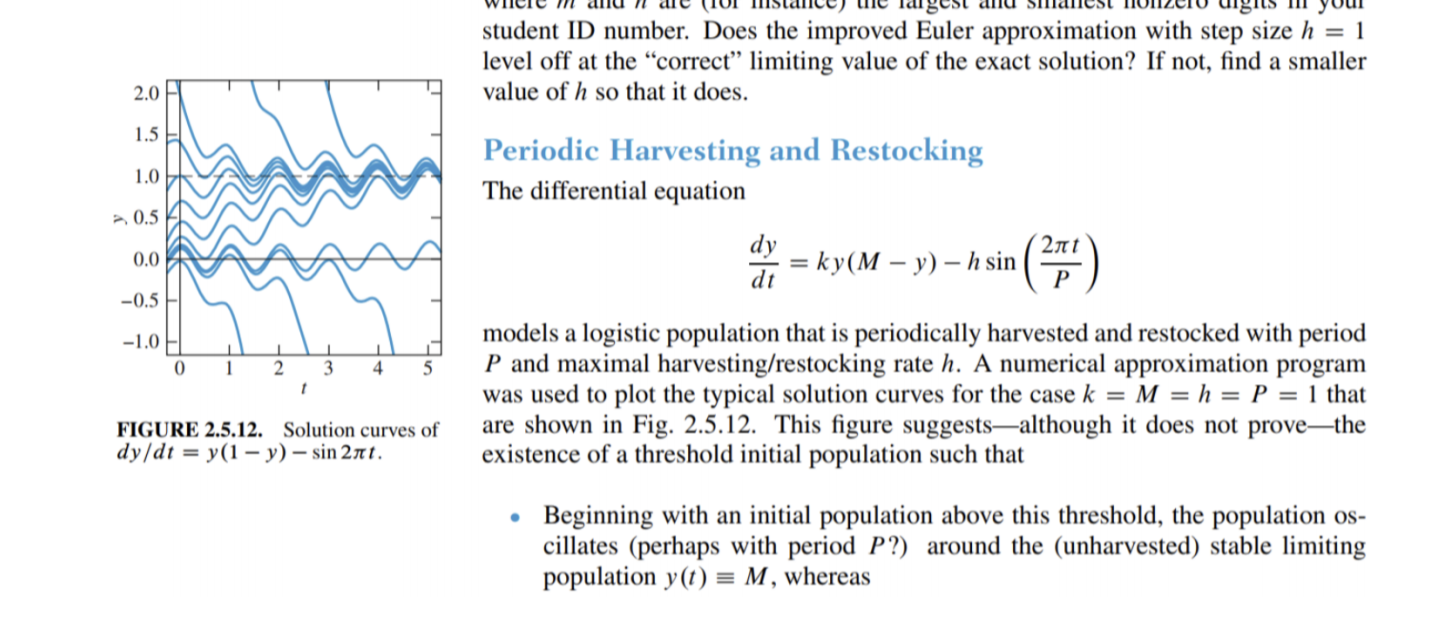
student ID number. Does the improved Euler approximation with step size h = 1 level off at the correct limiting value of the exact solution? If not, find a smaller value of h so that it does. 2.0 1.5 1.0 0.5 Periodic Harvesting and Restocking The differential equation dy = ky(M y) h sin dt (27) 0.0 -0.5 -1.0 0 1 2 3 4 5 1 models a logistic population that is periodically harvested and restocked with period P and maximal harvesting/restocking rate h. A numerical approximation program was used to plot the typical solution curves for the case k = M = h = P = 1 that are shown in Fig. 2.5.12. This figure suggestsalthough it does not provethe existence of a threshold initial population such that FIGURE 2.5.12. Solution curves of dy/dt = y(1 - y) - sin 2nt. Beginning with an initial population above this threshold, the population os- cillates (perhaps with period P?) around the (unharvested) stable limiting population y(t) = M, whereas k=1; M=1; h=1; P=1; t= 0:h:100; %assumption N= length(t); y= zeros(1, length(t)); y(1)= M; %assumption syms ty f= diff(y)== k*y*(M-y)-(h* sin((2*pi*t)/P)); [t,y]= impeuler(f,t,y,k,M, h,P); %function call figure(1) plot(t,y) xlabel('t') ylabel('y') Fix 4 Input argument 'M' might be unused, although a later one is used. Consider replacing it by ~, function [t,y)= impeuler(f,t,y,k,M,h,P,N) for i= 1:N k1= f(t(i),y(i)); k2= f(t(i)+h, y(i)+h*k1); k= ((1+k2)/2; t(i+1)= t(i)+h; y(i+1)=y(i) +h*k; end end Not enough input arguments. Error in untitled2>impeuler (line 96) for i= 1:N Error in untitled2 (line 87) [t,y]= impeuler(f,t,y,k,M, h,P); %function call
Step by Step Solution
There are 3 Steps involved in it

Get step-by-step solutions from verified subject matter experts