

Question: how do I create an R script that tabulates a statistical description of the model using R's summary() function? i need to predict the population
how do I create an R script that tabulates a statistical description of the model using R's summary() function?
i need to predict the population size of the state i am analyzing in five years using a linear regression from question a which i am attaching a screenshot of its results?
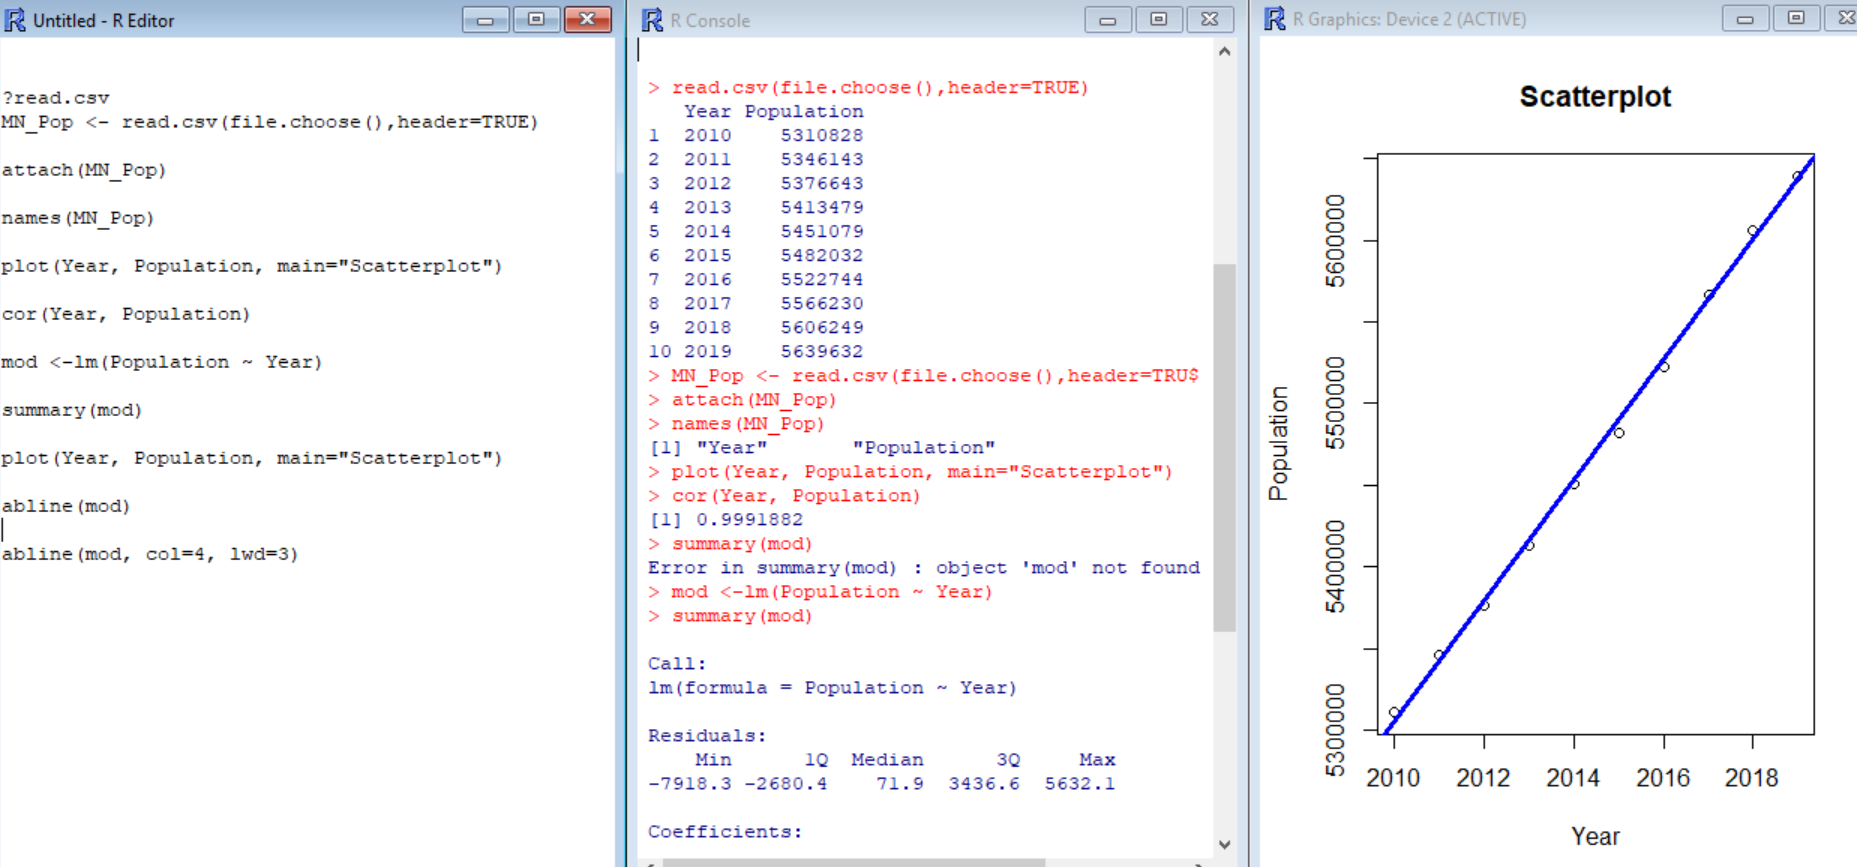
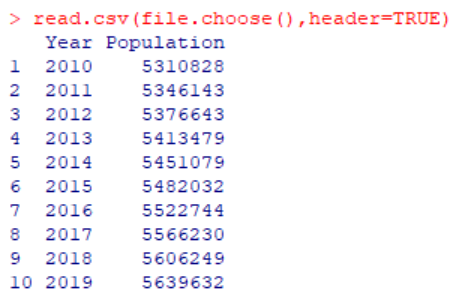
R Untitled - R Editor X R R Console X R R Graphics: Device 2 (ACTIVE) X ?read. csv > read. csv (file . choose ( ) , header=TRUE) Year Population Scatterplot MN Pop MN Pop attach (MN_Pop) > names (MN_Pop) plot (Year, Population, main="Scatterplot") ] "Year" "Population" 5500000 > plot (Year, Population, main="Scatterplot") abline (mod) > cor (Year, Population) Population [1] 0. 9991882 abline (mod, col=4, 1wd=3) > summary (mod) Error in summary (mod) : object 'mod' not found > mod summary (mod) 5400000 Call : Im (formula = Population ~ Year) Residuals : Min 1Q Median 30 Max -7918.3 -2680.4 71.9 3436.6 5632.1 5300000 2010 2012 2014 2016 2018 Coefficients : Year\f
Step by Step Solution
There are 3 Steps involved in it

Get step-by-step solutions from verified subject matter experts