

Question: How do I determine the Standard Deviations for the above and below average for this? photo attached with the data Information From Samples Sample Number
How do I determine the Standard Deviations for the above and below average for this? photo attached with the data
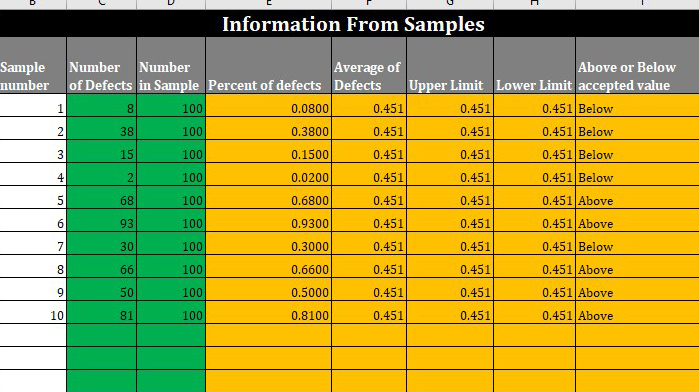
Information From Samples Sample Number Number Average of Above or Below number of Defects in Sample |Percent of defects Defects Upper Limit Lower Limit accepted value H 8 100 0.0800 0.451 0.451 0.451 Below 2 38 100 0.3800 0.451 0.451 0.451 Below 15 100 0.1500 0.451 0.451 0.451 Below 2 100 0.0200 0.451 0.451 0.451 Below 68 100 0.6800 0.451 0.451 0.451 Above 6 93 100 0.9300 0.451 0.451 0.451 Above 30 100 0.3000 0.451 0.451 0.451 Below CO 66 100 0.6600 0.451 0.451 0.451 Above 50 100 0.5000 0.451 0.451 0.451 Above 10 81 100 0.8100 0.451 0.451 0.451 Above
Step by Step Solution
There are 3 Steps involved in it

Get step-by-step solutions from verified subject matter experts