

Question: How do I do a sensitivity analysis of this graph? Equity/share at perpetual growth rate sensitivities Long term growth rate 2.5% 2.8% 3.0% 3.3% 3.5%
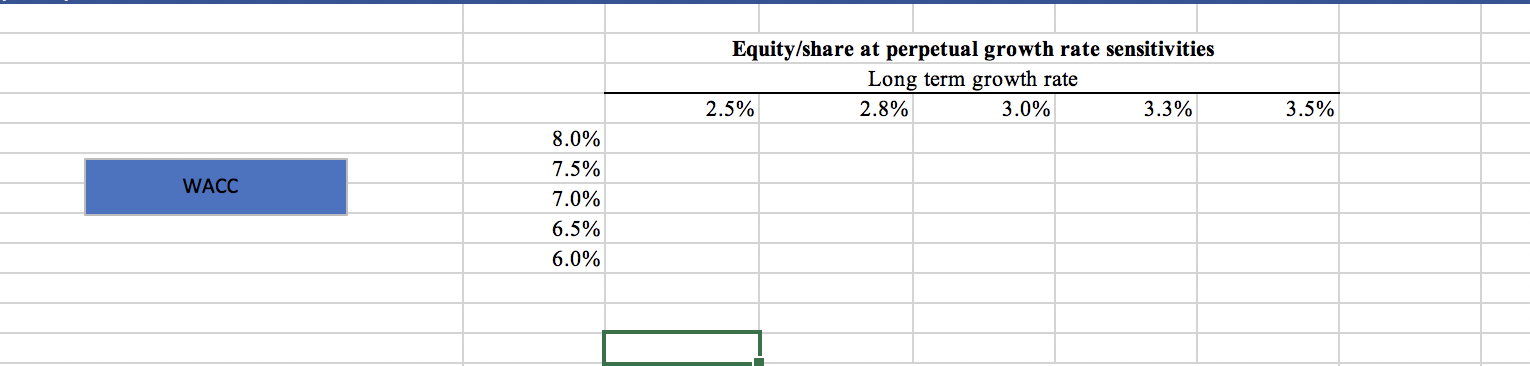
How do I do a sensitivity analysis of this graph?
Equity/share at perpetual growth rate sensitivities Long term growth rate 2.5% 2.8% 3.0% 3.3% 3.5% WACC 8.0% 7.5% 7.0% 6.5% 6.0%
Step by Step Solution
There are 3 Steps involved in it
1 Expert Approved Answer
Step: 1 Unlock

Question Has Been Solved by an Expert!
Get step-by-step solutions from verified subject matter experts
Step: 2 Unlock
Step: 3 Unlock