

Question: How do I do this in excel? I included my chart if that helps. 9. Using Conditional Formatting, highlight all static budget variances that vary
How do I do this in excel? I included my chart if that helps. 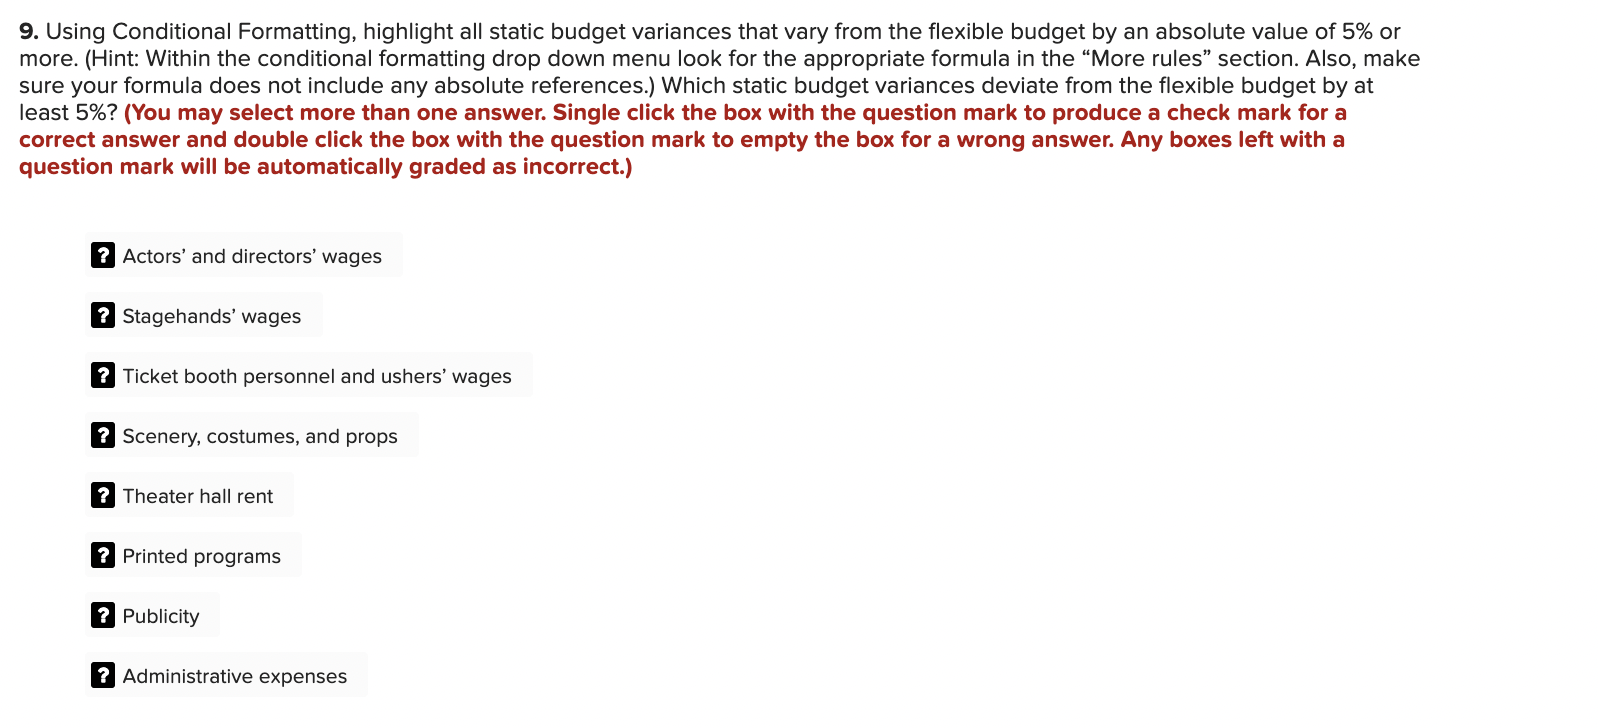
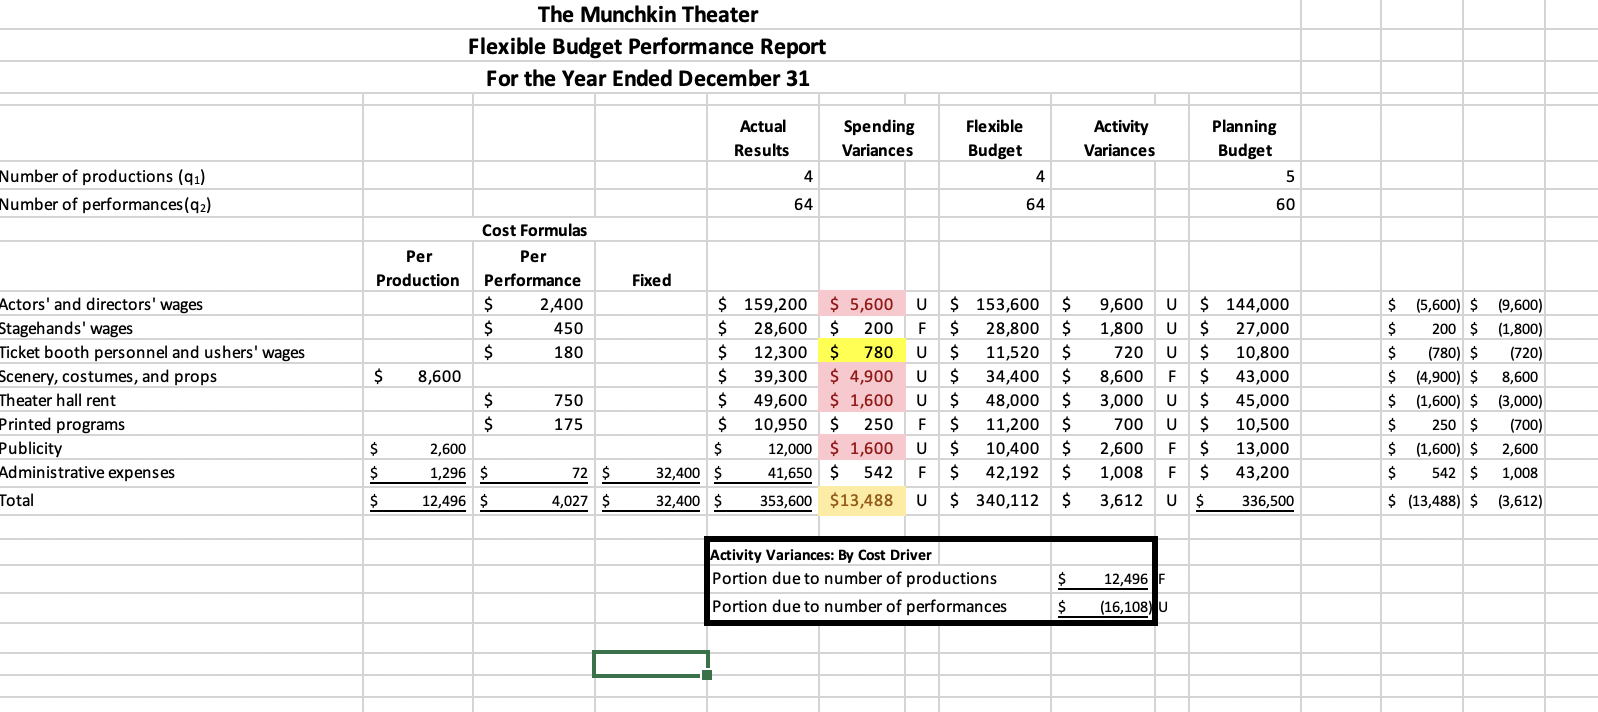
9. Using Conditional Formatting, highlight all static budget variances that vary from the flexible budget by an absolute value of 5% or more. (Hint: Within the conditional formatting drop down menu look for the appropriate formula in the "More rules" section. Also, make sure your formula does not include any absolute references.) Which static budget variances deviate from the flexible budget by at least 5%? (You may select more than one answer. Single click the box with the question mark to produce a check mark for a correct answer and double click the box with the question mark to empty the box for a wrong answer. Any boxes left with a question mark will be automatically graded as incorrect.) ? Actors' and directors' wages ? Stagehands' wages ? Ticket booth personnel and ushers' wages ? Scenery, costumes, and props ? Theater hall rent ? Printed programs ? Publicity ? Administrative expenses Number of productions (9) Number of performances (92) Actors' and directors' wages Stagehands' wages Ticket booth personnel and ushers' wages Scenery, costumes, and props Theater hall rent Printed programs Publicity Administrative expenses Total Per Production $ $ $ $ 8,600 The Munchkin Theater Flexible Budget Performance Report For the Year Ended December 31 Cost Formulas Per Performance $ 2,400 $ 450 180 $ $ $ 2,600 1,296 $ 12,496 $ 750 175 72 $ 4,027 $ Fixed $ $ $ $ $ $ $ 32,400 $ 32,400 $ Actual Results 4 64 Spending Variances Flexible Budget 4 64 Activity Variances: By Cost Driver Portion due to number of productions Portion due to number of performances Activity Variances $ $ Planning Budget 159,200 $ 5,600 U $ 153,600 $ 9,600 U $ 144,000 28,600 $ 200 F $ 28,800 $ 1,800 U $ 27,000 12,300 $ 780 U $ 11,520 $ 720 U $ 10,800 39,300 $4,900 U $ 34,400 $ 8,600 F $ 43,000 49,600 $1,600 U $ 48,000 $ 3,000 U $ 45,000 10,950 $ 250 F $ 11,200 $ 700 U $ 10,500 12,000 $1,600 U $ 10,400 $ 2,600 F $ 13,000 41,650 $ 542 F $ 42,192 $ 1,008 F $ 43,200 353,600 $13,488 U $ 340,112 $ 3,612 U $ 336,500 12,496 F (16,108) U 5 60 $ (5,600) $ (9,600) $ 200 $ (1,800) $ (780) $ (720) $ (4,900) $ 8,600 $ (1,600) $ (3,000) $ 250 $ (700) $ (1,600) $ $ 542 $ $ (13,488) $ 2,600 1,008 (3,612) 9. Using Conditional Formatting, highlight all static budget variances that vary from the flexible budget by an absolute value of 5% or more. (Hint: Within the conditional formatting drop down menu look for the appropriate formula in the "More rules" section. Also, make sure your formula does not include any absolute references.) Which static budget variances deviate from the flexible budget by at least 5%? (You may select more than one answer. Single click the box with the question mark to produce a check mark for a correct answer and double click the box with the question mark to empty the box for a wrong answer. Any boxes left with a question mark will be automatically graded as incorrect.) ? Actors' and directors' wages ? Stagehands' wages ? Ticket booth personnel and ushers' wages ? Scenery, costumes, and props ? Theater hall rent ? Printed programs ? Publicity ? Administrative expenses Number of productions (9) Number of performances (92) Actors' and directors' wages Stagehands' wages Ticket booth personnel and ushers' wages Scenery, costumes, and props Theater hall rent Printed programs Publicity Administrative expenses Total Per Production $ $ $ $ 8,600 The Munchkin Theater Flexible Budget Performance Report For the Year Ended December 31 Cost Formulas Per Performance $ 2,400 $ 450 180 $ $ $ 2,600 1,296 $ 12,496 $ 750 175 72 $ 4,027 $ Fixed $ $ $ $ $ $ $ 32,400 $ 32,400 $ Actual Results 4 64 Spending Variances Flexible Budget 4 64 Activity Variances: By Cost Driver Portion due to number of productions Portion due to number of performances Activity Variances $ $ Planning Budget 159,200 $ 5,600 U $ 153,600 $ 9,600 U $ 144,000 28,600 $ 200 F $ 28,800 $ 1,800 U $ 27,000 12,300 $ 780 U $ 11,520 $ 720 U $ 10,800 39,300 $4,900 U $ 34,400 $ 8,600 F $ 43,000 49,600 $1,600 U $ 48,000 $ 3,000 U $ 45,000 10,950 $ 250 F $ 11,200 $ 700 U $ 10,500 12,000 $1,600 U $ 10,400 $ 2,600 F $ 13,000 41,650 $ 542 F $ 42,192 $ 1,008 F $ 43,200 353,600 $13,488 U $ 340,112 $ 3,612 U $ 336,500 12,496 F (16,108) U 5 60 $ (5,600) $ (9,600) $ 200 $ (1,800) $ (780) $ (720) $ (4,900) $ 8,600 $ (1,600) $ (3,000) $ 250 $ (700) $ (1,600) $ $ 542 $ $ (13,488) $ 2,600 1,008 (3,612)
Step by Step Solution
There are 3 Steps involved in it

Get step-by-step solutions from verified subject matter experts