

Question: how do i estimate free cash flow for 2015 if there is no information availble. her is the ptoblem there is know information, so inhabe
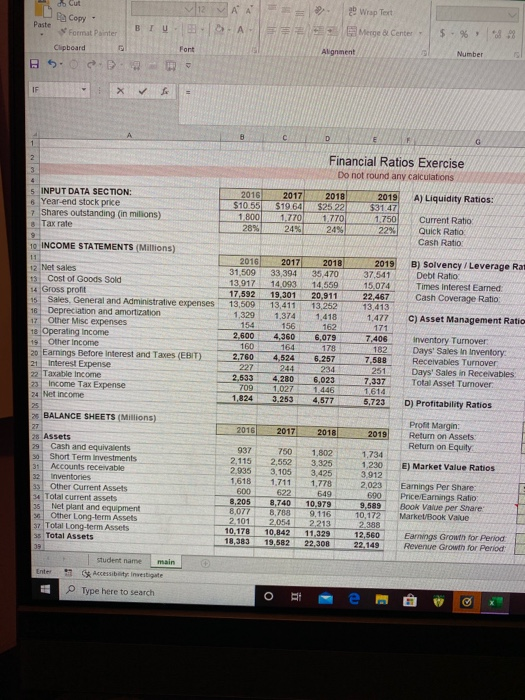
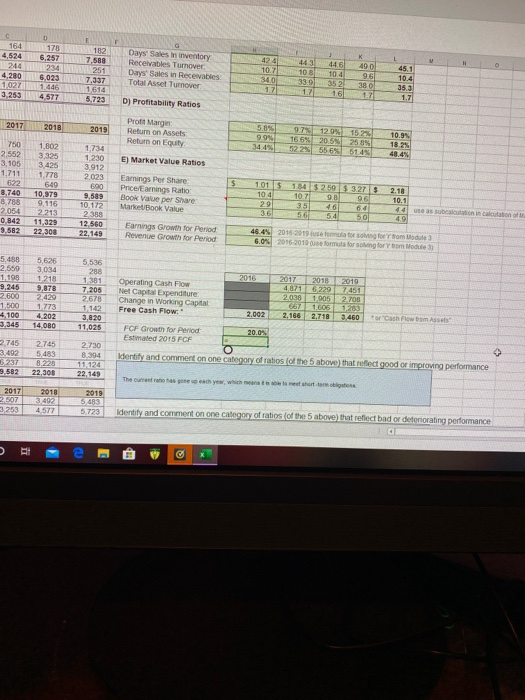
- Cut Copy Paste Wrap Text Merge & Center - DIU- 5 % . Format P Clipboard Alignment Number SI BCD Financial Ratios Exercise Do not round any calculations A) Liquidity Ratios: 5 INPUT DATA SECTION: 6 Year-end stock price 7 Shares outstanding (in milions) 8 Tax rate 2016 $10.55 1.800 28% 2017 $19.64 1.770 24% 2018 $25.22 1.770 24% 2019 $31.47 1.750 22% Current Ratio Quick Ratio Cash Ratio 10 INCOME STATEMENTS (Millions) 2016 31,509 13 917 17,592 13,509 1329 2017 33 394 14.093 19,301 13,411 1,374 156 4.360 2018 35.470 14,559 20,911 13.252 1418 162 6.079 2019 37 541 15.074 2 2,467 13 413 1,477 B) Solvency / Leverage Rat Debt Ratio Times Interest Eamed: Cash Coverage Ratio 12 Net sales 15 Cost of Goods Sold 14 Gross pront 15 Sales. General and Administrative expenses 18 Depreciation and amortization 17 Other Misc expenses 18 Operating Income 19 Other Income 20 Earnings Before Interest and Taxes (EBIT) 21 Interest Expense 22 Taxable income 23 Income Tax Expense 24 Net income C) Asset Management Ratio 154 2,600 178 2.760 227 2.533 709 1,824 4,5246.257 244 234 4,280 6,023 1,027 3.253 4,577 7,406 182 7.588 251 7,337 Inventory Turnover Days' Sales In Inventory Receivables Turnover Days' Sales in Receivables Total Asset Turnover 1,614 5,723 D) Profitability Ratios 25 BALANCE SHEETS (Millions) 2016 2017 2018 2019 Profit Margin: Return on Assets Return on Equity 28 Assets 29 Cash and equivalents 30 Short Term Investments 31 Accounts receivable 32 Inventories 33 Other Current Assets 34 Total current assets 35 Net plant and equipment 36 Other Long-term Assets 37 Total Long-term Assets 3 Total Assets 1,734 1.230 3.912 2,023 E) Market Value Ratios 937 2.115 2935 1.618 600 8,205 8,077 2.101 10,178 18.383 750 2.552 3.105 1.711 622 8.740 8.788 2054 10,842 19.582 1.802 3.325 3.425 1,778 549 10.979 9.116 2213 11.329 22.30 690 Earnings Per Share: Price Earnings Ratio Book Value per Share Market/Book Value 9,589 10,172 2.388 12,560 22.149 Earrings Growth for Period Revenue Growth for Period Enter student name main Accessibi investigate Type here to search 524 244 443 5.257 234 6,0237 132 7.500 251 ,337 1514 5723 Days Sales in inventory Receivables Turnover Days Sales in Recevables Total Asset Tumover 10.7 34.0 10 13:02 ga 0271 253 4.527 D) Profitability Ratios 2017 2019 Profit Margin: Return on Assets Return on Equity E) Market Value Ratios 3.425 1.734 1230 3912 2023 TO 1.802 .652 3325 105 711 1.778 540 1.740 10,975 13 9.116 054 2213 2.842 11,329 582 22 300 Earnings Per Share Pricemings Ratio Book Value per Share MarkeBook Value 101 518452915 327 2.18 100 2935060 5. 6450 9.589 10.172 2 33 12.560 22.149 Earnings Growth for Period Revenue Growth for Period 45.45 201 6 2016-2010m for s 3 tor om 5.488 5.536 2.550 5.626 3014 1.218 9.870 2016 2017 2018 2019 48716 2207,451 2.038 1.905 2.708 2,245 Operating Cash Flo Net Capital Expenditure Change in Working Capital Free Cash Flow 1.500 4,100 7.205 2678 1.142 3.820 11.025 1.773 4.202 2,092 2.100 2.710 3.450 Cash FCF Grown for period Estimated 2015 FCF 20.09 2745 3.492 237 2.502 2745 5.483 2 22.300 2.730 8 .394 11,124 22.149 Identify and comment on one category of ratios of the 5 above) that need good or improving performance 2019 2017 2018 07492 253 4577 5 .723 identity and comment on one category of ratios of the 5 above that refled bad or de orang performance - Cut Copy Paste Wrap Text Merge & Center - DIU- 5 % . Format P Clipboard Alignment Number SI BCD Financial Ratios Exercise Do not round any calculations A) Liquidity Ratios: 5 INPUT DATA SECTION: 6 Year-end stock price 7 Shares outstanding (in milions) 8 Tax rate 2016 $10.55 1.800 28% 2017 $19.64 1.770 24% 2018 $25.22 1.770 24% 2019 $31.47 1.750 22% Current Ratio Quick Ratio Cash Ratio 10 INCOME STATEMENTS (Millions) 2016 31,509 13 917 17,592 13,509 1329 2017 33 394 14.093 19,301 13,411 1,374 156 4.360 2018 35.470 14,559 20,911 13.252 1418 162 6.079 2019 37 541 15.074 2 2,467 13 413 1,477 B) Solvency / Leverage Rat Debt Ratio Times Interest Eamed: Cash Coverage Ratio 12 Net sales 15 Cost of Goods Sold 14 Gross pront 15 Sales. General and Administrative expenses 18 Depreciation and amortization 17 Other Misc expenses 18 Operating Income 19 Other Income 20 Earnings Before Interest and Taxes (EBIT) 21 Interest Expense 22 Taxable income 23 Income Tax Expense 24 Net income C) Asset Management Ratio 154 2,600 178 2.760 227 2.533 709 1,824 4,5246.257 244 234 4,280 6,023 1,027 3.253 4,577 7,406 182 7.588 251 7,337 Inventory Turnover Days' Sales In Inventory Receivables Turnover Days' Sales in Receivables Total Asset Turnover 1,614 5,723 D) Profitability Ratios 25 BALANCE SHEETS (Millions) 2016 2017 2018 2019 Profit Margin: Return on Assets Return on Equity 28 Assets 29 Cash and equivalents 30 Short Term Investments 31 Accounts receivable 32 Inventories 33 Other Current Assets 34 Total current assets 35 Net plant and equipment 36 Other Long-term Assets 37 Total Long-term Assets 3 Total Assets 1,734 1.230 3.912 2,023 E) Market Value Ratios 937 2.115 2935 1.618 600 8,205 8,077 2.101 10,178 18.383 750 2.552 3.105 1.711 622 8.740 8.788 2054 10,842 19.582 1.802 3.325 3.425 1,778 549 10.979 9.116 2213 11.329 22.30 690 Earnings Per Share: Price Earnings Ratio Book Value per Share Market/Book Value 9,589 10,172 2.388 12,560 22.149 Earrings Growth for Period Revenue Growth for Period Enter student name main Accessibi investigate Type here to search 524 244 443 5.257 234 6,0237 132 7.500 251 ,337 1514 5723 Days Sales in inventory Receivables Turnover Days Sales in Recevables Total Asset Tumover 10.7 34.0 10 13:02 ga 0271 253 4.527 D) Profitability Ratios 2017 2019 Profit Margin: Return on Assets Return on Equity E) Market Value Ratios 3.425 1.734 1230 3912 2023 TO 1.802 .652 3325 105 711 1.778 540 1.740 10,975 13 9.116 054 2213 2.842 11,329 582 22 300 Earnings Per Share Pricemings Ratio Book Value per Share MarkeBook Value 101 518452915 327 2.18 100 2935060 5. 6450 9.589 10.172 2 33 12.560 22.149 Earnings Growth for Period Revenue Growth for Period 45.45 201 6 2016-2010m for s 3 tor om 5.488 5.536 2.550 5.626 3014 1.218 9.870 2016 2017 2018 2019 48716 2207,451 2.038 1.905 2.708 2,245 Operating Cash Flo Net Capital Expenditure Change in Working Capital Free Cash Flow 1.500 4,100 7.205 2678 1.142 3.820 11.025 1.773 4.202 2,092 2.100 2.710 3.450 Cash FCF Grown for period Estimated 2015 FCF 20.09 2745 3.492 237 2.502 2745 5.483 2 22.300 2.730 8 .394 11,124 22.149 Identify and comment on one category of ratios of the 5 above) that need good or improving performance 2019 2017 2018 07492 253 4577 5 .723 identity and comment on one category of ratios of the 5 above that refled bad or de orang performance
Step by Step Solution
There are 3 Steps involved in it

Get step-by-step solutions from verified subject matter experts