

Question: How do I explain and graph change in demand with this subsidy. The Donkey Market Price (Yuanes) Price (USD) Quantity Demanded Quantity Supplied *1,100.00 S
How do I explain and graph change in demand with this subsidy.
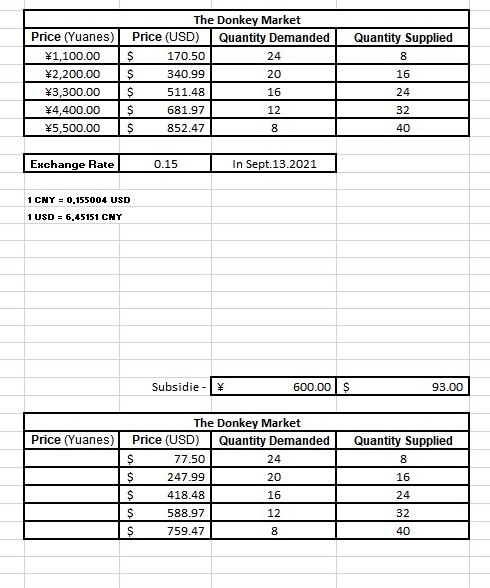
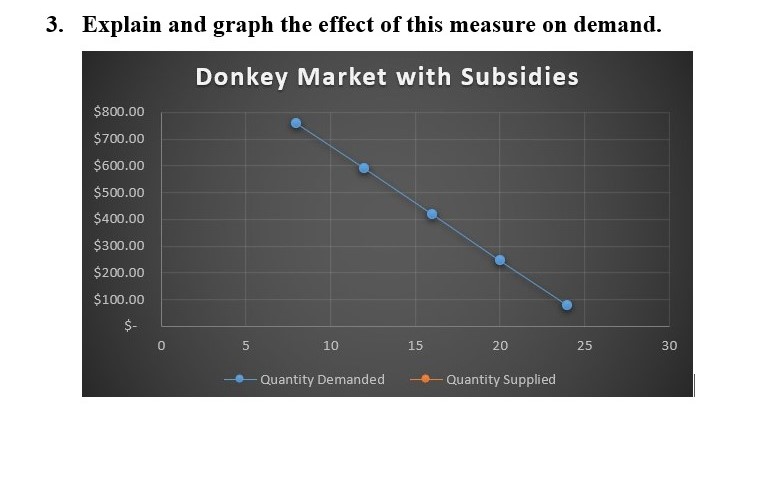
The Donkey Market Price (Yuanes) Price (USD) Quantity Demanded Quantity Supplied *1,100.00 S 170.50 24 8 *2,200.00 340.99 20 16 *3,300.00 511.48 16 24 #4,400.00 S 681.97 12 32 15,500.00 852.47 8 40 Exchange Rate 0.15 In Sept.13.2021 1 CNY = 0.155004 USD 1 USD = 6,45151 CHY Subsidie - 600.00 | $ 93.00 The Donkey Market Price (Yuanes) Price (USD) Quantity Demanded Quantity Supplied 77.50 24 8 247.99 20 16 418.48 16 24 588.97 12 32 759.47 8 403. Explain and graph the effect of this measure on demand. Donkey Market with Subsidies
Step by Step Solution
There are 3 Steps involved in it
1 Expert Approved Answer
Step: 1 Unlock

Question Has Been Solved by an Expert!
Get step-by-step solutions from verified subject matter experts
Step: 2 Unlock
Step: 3 Unlock