

Question: How do I explain the trends from Apple Inc. from Sales and Net Income from the attached graph. Sales and Income Record: Fiscal Years 2015
How do I explain the trends from Apple Inc. from Sales and Net Income from the attached graph.
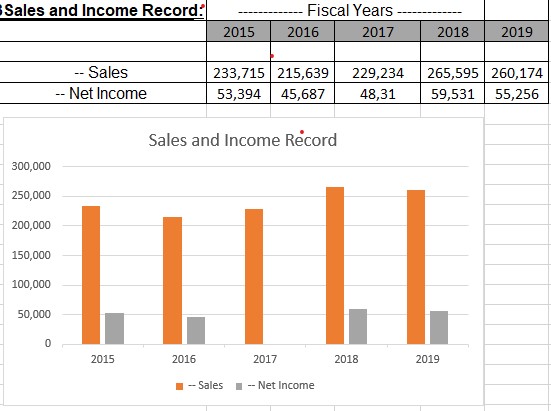
Sales and Income Record:" Fiscal Years 2015 2016 2017 2018 2019 Sales 233,715 215,639 229,234 265,595 260,174 -- Net Income 53,394 45,687 48,31 59,531 55,256 Sales and Income Record 300,000 250,000 200,000 150,000 100,000 50,000 0 2015 2016 2017 2018 2019 - Sales -- Net Income
Step by Step Solution
There are 3 Steps involved in it
1 Expert Approved Answer
Step: 1 Unlock

Question Has Been Solved by an Expert!
Get step-by-step solutions from verified subject matter experts
Step: 2 Unlock
Step: 3 Unlock