

Question: How do I find the planned operating expense %, season turn, and net profit % (the three empty grey cells at the top right) with
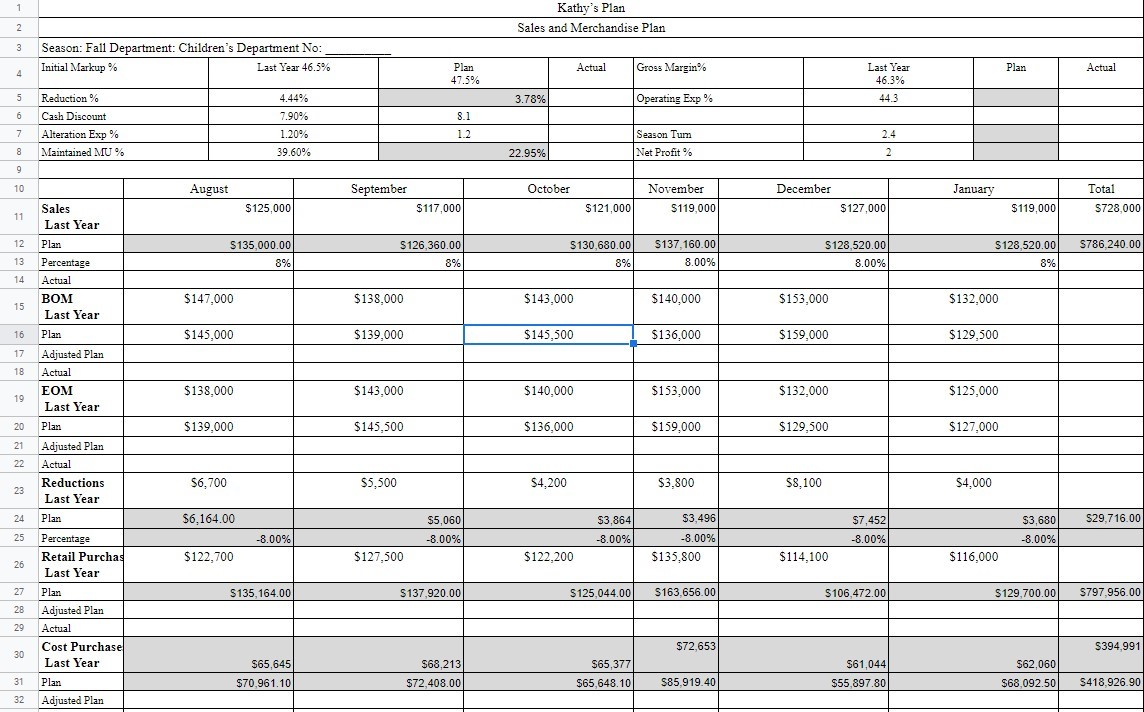
How do I find the planned operating expense %, season turn, and net profit % (the three empty grey cells at the top right) with the below given information in the chart?
| Kathys Plan | ||||||||||||
| Sales and Merchandise Plan | ||||||||||||
| Season: Fall Department: Childrens Department No: __________ | ||||||||||||
| Initial Markup % | Last Year 46.5% | Plan 47.5% | Actual | Gross Margin% | Last Year 46.3% | Plan | Actual | |||||
| Reduction % | 4.44% | 3.78% | Operating Exp % | 44.3 | ||||||||
| Cash Discount | 7.90% | 8.1 | ||||||||||
| Alteration Exp % | 1.20% | 1.2 | Season Turn | 2.4 | ||||||||
| Maintained MU % | 39.60% | 22.95% | Net Profit % | 2 | ||||||||
| August | September | October | November | December | January | Total | ||||||
| Sales Last Year | $125,000 | $117,000 | $121,000 | $119,000 | $127,000 | $119,000 | $728,000 | |||||
| Plan | $135,000.00 | $126,360.00 | $130,680.00 | $137,160.00 | $128,520.00 | $128,520.00 | $786,240.00 | |||||
| Percentage | 8% | 8% | 8% | 8.00% | 8.00% | 8% | ||||||
| Actual | ||||||||||||
| BOM Last Year | $147,000 | $138,000 | $143,000 | $140,000 | $153,000 | $132,000 | ||||||
| Plan | $145,000 | $139,000 | $145,500 | $136,000 | $159,000 | $129,500 | ||||||
| Adjusted Plan | ||||||||||||
| Actual | ||||||||||||
| EOM Last Year | $138,000 | $143,000 | $140,000 | $153,000 | $132,000 | $125,000 | ||||||
| Plan | $139,000 | $145,500 | $136,000 | $159,000 | $129,500 | $127,000 | ||||||
| Adjusted Plan | ||||||||||||
| Actual | ||||||||||||
| Reductions Last Year | $6,700 | $5,500 | $4,200 | $3,800 | $8,100 | $4,000 | ||||||
| Plan | $6,164.00 | $5,060 | $3,864 | $3,496 | $7,452 | $3,680 | $29,716.00 | |||||
| Percentage | -8.00% | -8.00% | -8.00% | -8.00% | -8.00% | -8.00% | ||||||
| Retail Purchases Last Year | $122,700 | $127,500 | $122,200 | $135,800 | $114,100 | $116,000 | ||||||
| Plan | $135,164.00 | $137,920.00 | $125,044.00 | $163,656.00 | $106,472.00 | $129,700.00 | $797,956.00 | |||||
| Adjusted Plan | ||||||||||||
| Actual | ||||||||||||
| Cost Purchases Last Year | $65,645 | $68,213 | $65,377 | $72,653 | $61,044 | $62,060 | $394,991 | |||||
| Plan | $70,961.10 | $72,408.00 | $65,648.10 | $85,919.40 | $55,897.80 | $68,092.50 | $418,926.90 | |||||
| Adjusted Plan | ||||||||||||
Kathy's Plan Sales and Merchandise Plan 3 Season: Fall Department: Children's Department No: Initial Markup % Last Year 46.5% Actual Plan 47.5% Gross Margin% Plan Actual Last Year 46.3% 4.44% 3.78% Operating Exp% 44.3 8.1 5 6 7 8 Reduction% Cash Discount Alteration Exp% Maintained MU % 7.90% 1.20% 39.60% 1.2 Season Tum Net Profit % 22.95% August September October December January November $119,000 Total 5728,000 $125,000 $117,000 $121,000 Sales Last Year $127,000 $119,000 12 9786, 240.00 $135,000.00 8% $126.360.00 8% $130.680.00 8% $137,160.00 8.00% 5128,520.00 8.00% $128.520.00 8% 13 14 Plan Percentage Actual BOM Last Year $147,000 $138.000 $143.000 $140,000 $153,000 $132.000 16 Plan $145,000 $139,000 $145,500 $136,000 $159,000 $129,500 17 Adjusted Plan Actual EOM Last Year $138.000 $143,000 $140,000 $153,000 $132.000 $125,000 Plan $139,000 $145,500 $136,000 $159,000 $129.500 $127,000 22 Adjusted Plan Actual Reductions Last Year $6,700 $5,500 $4,200 $3,800 $8.100 $4.000 Plan 56.164.00 $3,864 S29,716.00 $5,060 -8.00% $7,452 -8.00% $3,680 -8.00% -8.00% $3,496 -8.00% $135,800 -8.00% | Percentage Retail Purchas Last Year $122,700 $127.500 $122,200 $114,100 $116,000 Plan S135,164.00 $137,920.00 $125,044.00 $163,656.00 $106.472.00 $129,700.00 9797,956.00 29 $72,653 $394.991 Adjusted Plan Actual Cost Purchase Last Year Plan Adjusted Plan $65,645 $70.961.10 $68,213 $72,408.00 $65,377 $65,648.10 $61,044 $55,897.80 $62,060 $68,092.50 $85,919.40 S418,926.90 31 32 Kathy's Plan Sales and Merchandise Plan 3 Season: Fall Department: Children's Department No: Initial Markup % Last Year 46.5% Actual Plan 47.5% Gross Margin% Plan Actual Last Year 46.3% 4.44% 3.78% Operating Exp% 44.3 8.1 5 6 7 8 Reduction% Cash Discount Alteration Exp% Maintained MU % 7.90% 1.20% 39.60% 1.2 Season Tum Net Profit % 22.95% August September October December January November $119,000 Total 5728,000 $125,000 $117,000 $121,000 Sales Last Year $127,000 $119,000 12 9786, 240.00 $135,000.00 8% $126.360.00 8% $130.680.00 8% $137,160.00 8.00% 5128,520.00 8.00% $128.520.00 8% 13 14 Plan Percentage Actual BOM Last Year $147,000 $138.000 $143.000 $140,000 $153,000 $132.000 16 Plan $145,000 $139,000 $145,500 $136,000 $159,000 $129,500 17 Adjusted Plan Actual EOM Last Year $138.000 $143,000 $140,000 $153,000 $132.000 $125,000 Plan $139,000 $145,500 $136,000 $159,000 $129.500 $127,000 22 Adjusted Plan Actual Reductions Last Year $6,700 $5,500 $4,200 $3,800 $8.100 $4.000 Plan 56.164.00 $3,864 S29,716.00 $5,060 -8.00% $7,452 -8.00% $3,680 -8.00% -8.00% $3,496 -8.00% $135,800 -8.00% | Percentage Retail Purchas Last Year $122,700 $127.500 $122,200 $114,100 $116,000 Plan S135,164.00 $137,920.00 $125,044.00 $163,656.00 $106.472.00 $129,700.00 9797,956.00 29 $72,653 $394.991 Adjusted Plan Actual Cost Purchase Last Year Plan Adjusted Plan $65,645 $70.961.10 $68,213 $72,408.00 $65,377 $65,648.10 $61,044 $55,897.80 $62,060 $68,092.50 $85,919.40 S418,926.90 31 32
Step by Step Solution
There are 3 Steps involved in it

Get step-by-step solutions from verified subject matter experts