

Question: How do I find this out for 2018? I can't figure out how to calculate EPS . Stock price is 91.18 according to directions. Question
How do I find this out for 2018? I can't figure out how to calculate EPS. Stock price is 91.18 according to directions.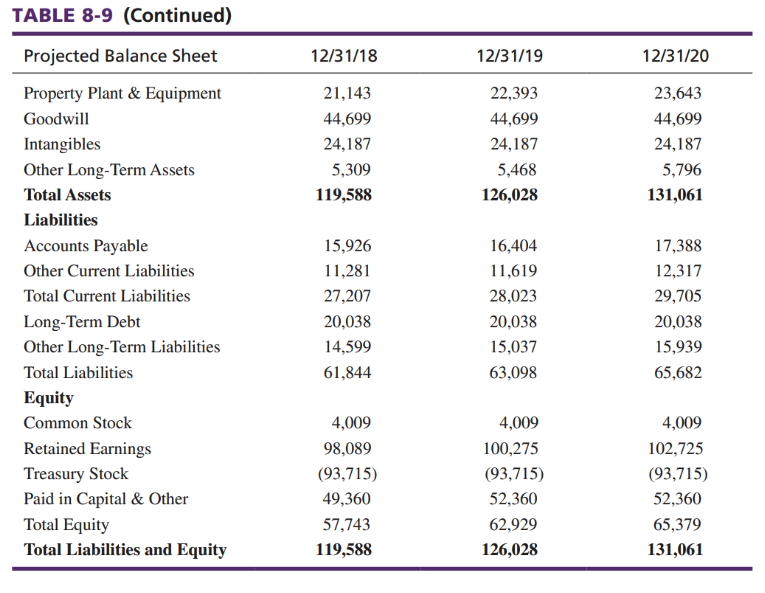
Question - Method 3 Price-Earnings Ratio Method = (Stock Price / EPS) X NI = (91.18/ ?????
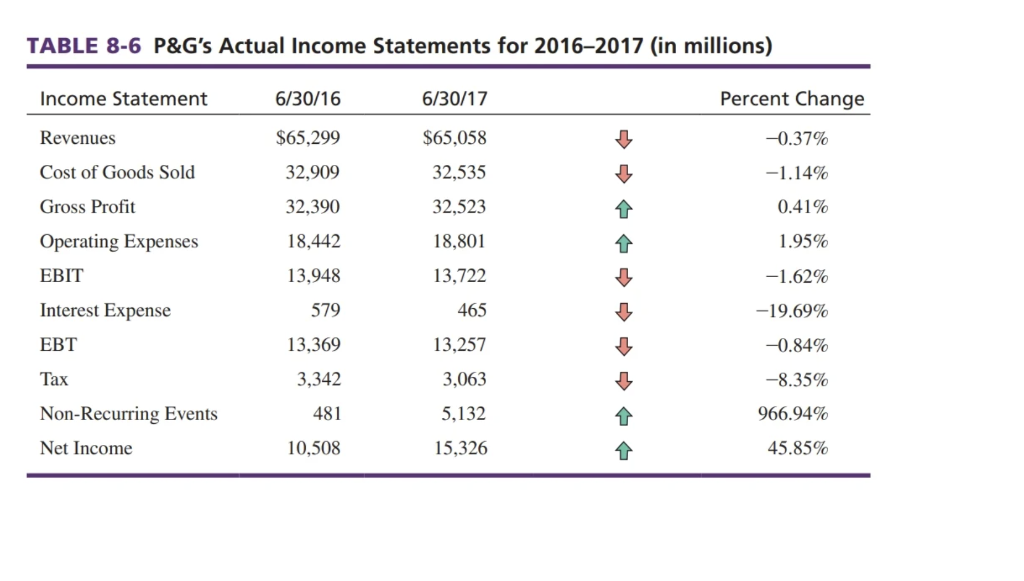
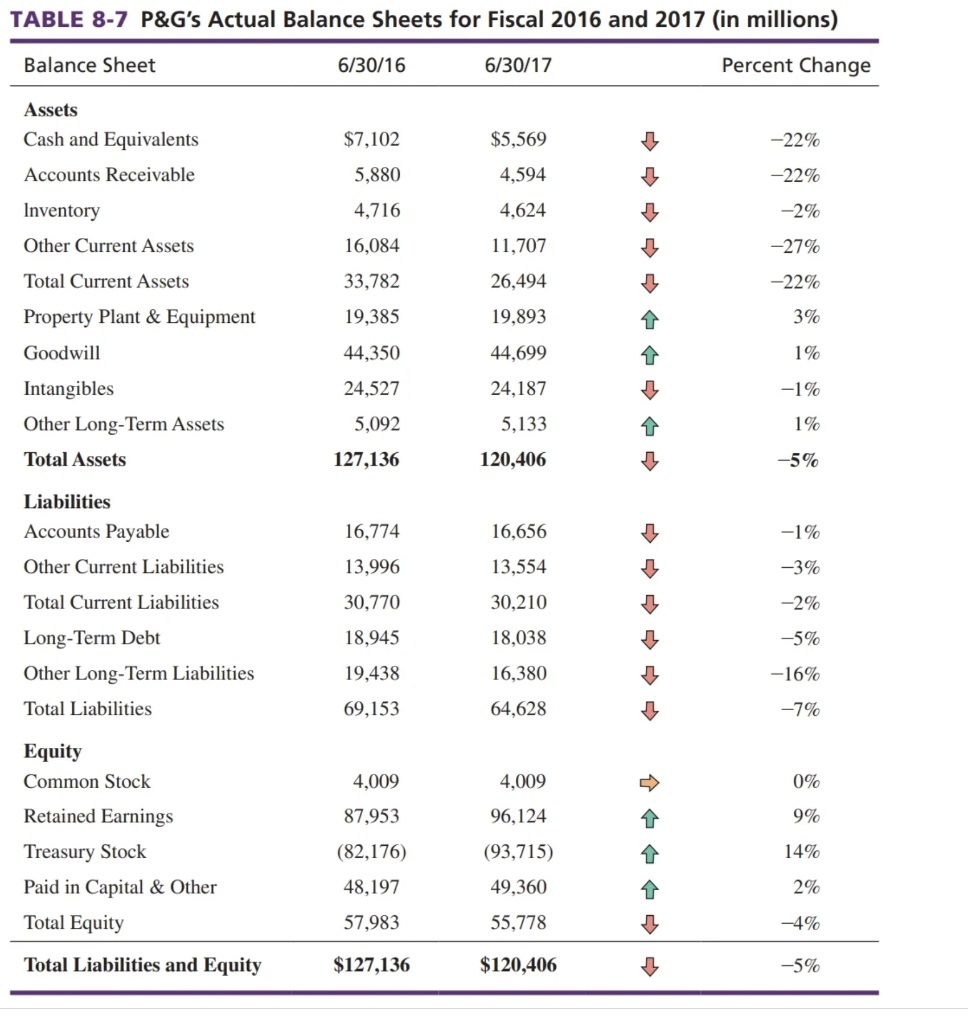
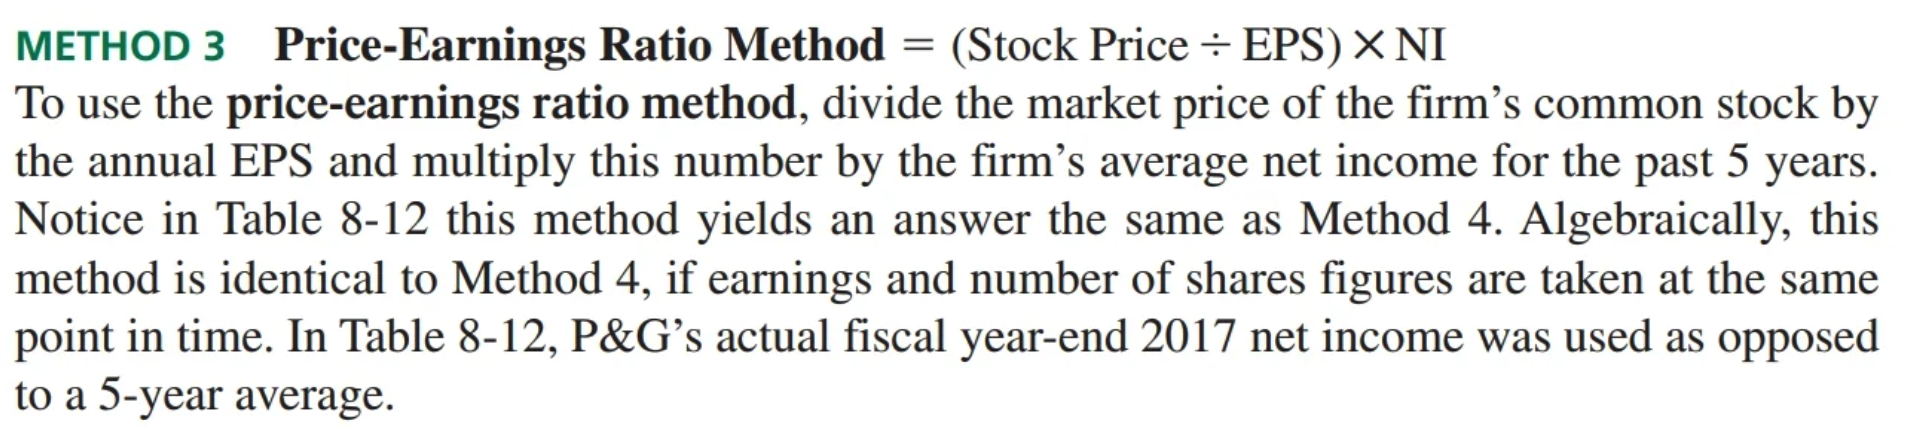
TABLE 8-9 (Continued) Projected Balance Sheet 12/31/18 12/31/19 12/31/20 21,143 44,699 24,187 5,309 119,588 22,393 44,699 24,187 5,468 126,028 23,643 44,699 24,187 5,796 131,061 Property Plant & Equipment Goodwill Intangibles Other Long-Term Assets Total Assets Liabilities Accounts Payable Other Current Liabilities Total Current Liabilities Long-Term Debt Other Long-Term Liabilities Total Liabilities Equity Common Stock Retained Earnings Treasury Stock Paid in Capital & Other Total Equity Total Liabilities and Equity 15,926 11,281 27,207 20,038 14,599 61,844 16,404 11,619 28,023 20,038 15,037 63,098 17,388 12,317 29,705 20,038 15,939 65,682 4,009 98,089 (93,715) 49,360 57,743 119,588 4,009 100,275 (93,715) 52,360 62,929 126,028 4,009 102,725 (93,715) 52,360 65,379 131,061 = METHOD 3 Price-Earnings Ratio Method = (Stock Price = EPS) X NI X To use the price-earnings ratio method, divide the market price of the firm's common stock by the annual EPS and multiply this number by the firm's average net income for the past 5 years. Notice in Table 8-12 this method yields an answer the same as Method 4. Algebraically, this method is identical to Method 4, if earnings and number of shares figures are taken at the same point in time. In Table 8-12, P&G's actual fiscal year-end 2017 net income was used as opposed to a 5-year average. TABLE 8-6 P&G's Actual Income Statements for 2016-2017 (in millions) Income Statement 6/30/16 6/30/17 Percent Change Revenues $65,299 $65,058 2 -0.37% Cost of Goods Sold 32,909 32,535 14 -1.14% Gross Profit 32,390 32,523 0.41% 18,442 18,801 1.95% Operating Expenses EBIT 13,948 13,722 -1.62% Interest Expense 579 465 -19.69% 13,369 13,257 -0.84% Tax 3,342 3,063 -8.35% 481 5,132 966.94% Non-Recurring Events Net Income 10,508 15,326 45.85% TABLE 8-7 P&G's Actual Balance Sheets for Fiscal 2016 and 2017 (in millions) Balance Sheet 6/30/16 6/30/17 Percent Change Assets Cash and Equivalents $7,102 $5,569 -22% Accounts Receivable 5,880 4,594 -22% Inventory 4,716 4,624 -2% Other Current Assets 16,084 11,707 -27% -22% Total Current Assets 33,782 26,494 19,385 19,893 3% 44,350 44,699 1% Property Plant & Equipment Goodwill Intangibles Other Long-Term Assets 24,527 24,187 -1% 5,092 5,133 1 1% Total Assets 127,136 120,406 -5% Liabilities Accounts Payable Other Current Liabilities 16,774 16,656 -1% 13,996 13,554 -3% Total Current Liabilities 30,770 30,210 -2% 18,945 18,038 -5% Long-Term Debt Other Long-Term Liabilities Total Liabilities 19,438 -16% 16,380 64,628 69,153 -7% 4,009 4,009 0% 87,953 9% Equity Common Stock Retained Earnings Treasury Stock Paid in Capital & Other Total Equity (82,176) 96,124 (93,715) 49,360 14% 48,197 2% 57,983 55,778 2 -4% Total Liabilities and Equity $127,136 $120,406 -5% TABLE 8-9 (Continued) Projected Balance Sheet 12/31/18 12/31/19 12/31/20 21,143 44,699 24,187 5,309 119,588 22,393 44,699 24,187 5,468 126,028 23,643 44,699 24,187 5,796 131,061 Property Plant & Equipment Goodwill Intangibles Other Long-Term Assets Total Assets Liabilities Accounts Payable Other Current Liabilities Total Current Liabilities Long-Term Debt Other Long-Term Liabilities Total Liabilities Equity Common Stock Retained Earnings Treasury Stock Paid in Capital & Other Total Equity Total Liabilities and Equity 15,926 11,281 27,207 20,038 14,599 61,844 16,404 11,619 28,023 20,038 15,037 63,098 17,388 12,317 29,705 20,038 15,939 65,682 4,009 98,089 (93,715) 49,360 57,743 119,588 4,009 100,275 (93,715) 52,360 62,929 126,028 4,009 102,725 (93,715) 52,360 65,379 131,061 = METHOD 3 Price-Earnings Ratio Method = (Stock Price = EPS) X NI X To use the price-earnings ratio method, divide the market price of the firm's common stock by the annual EPS and multiply this number by the firm's average net income for the past 5 years. Notice in Table 8-12 this method yields an answer the same as Method 4. Algebraically, this method is identical to Method 4, if earnings and number of shares figures are taken at the same point in time. In Table 8-12, P&G's actual fiscal year-end 2017 net income was used as opposed to a 5-year average. TABLE 8-6 P&G's Actual Income Statements for 2016-2017 (in millions) Income Statement 6/30/16 6/30/17 Percent Change Revenues $65,299 $65,058 2 -0.37% Cost of Goods Sold 32,909 32,535 14 -1.14% Gross Profit 32,390 32,523 0.41% 18,442 18,801 1.95% Operating Expenses EBIT 13,948 13,722 -1.62% Interest Expense 579 465 -19.69% 13,369 13,257 -0.84% Tax 3,342 3,063 -8.35% 481 5,132 966.94% Non-Recurring Events Net Income 10,508 15,326 45.85% TABLE 8-7 P&G's Actual Balance Sheets for Fiscal 2016 and 2017 (in millions) Balance Sheet 6/30/16 6/30/17 Percent Change Assets Cash and Equivalents $7,102 $5,569 -22% Accounts Receivable 5,880 4,594 -22% Inventory 4,716 4,624 -2% Other Current Assets 16,084 11,707 -27% -22% Total Current Assets 33,782 26,494 19,385 19,893 3% 44,350 44,699 1% Property Plant & Equipment Goodwill Intangibles Other Long-Term Assets 24,527 24,187 -1% 5,092 5,133 1 1% Total Assets 127,136 120,406 -5% Liabilities Accounts Payable Other Current Liabilities 16,774 16,656 -1% 13,996 13,554 -3% Total Current Liabilities 30,770 30,210 -2% 18,945 18,038 -5% Long-Term Debt Other Long-Term Liabilities Total Liabilities 19,438 -16% 16,380 64,628 69,153 -7% 4,009 4,009 0% 87,953 9% Equity Common Stock Retained Earnings Treasury Stock Paid in Capital & Other Total Equity (82,176) 96,124 (93,715) 49,360 14% 48,197 2% 57,983 55,778 2 -4% Total Liabilities and Equity $127,136 $120,406 -5%
Step by Step Solution
There are 3 Steps involved in it

Get step-by-step solutions from verified subject matter experts