

Question: How do I get this code on Jupiter notebooks to display a chart upyter Untitled2 Last Checkpoint: 2 hours ago (autosaved) Edit View Insert Cell
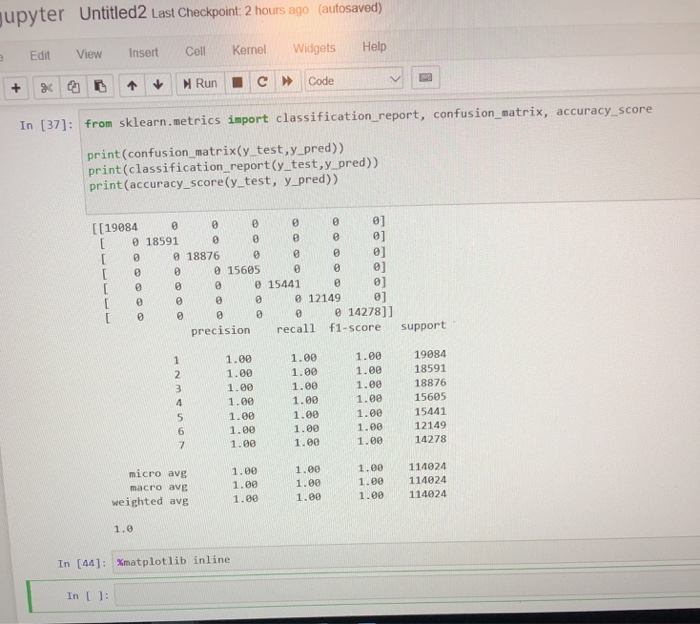
upyter Untitled2 Last Checkpoint: 2 hours ago (autosaved) Edit View Insert Cell Kenel Widgets Help In [37]: from sklearn.metrics import classification report, confusion matrix, accuracy score print (confusion matrix(y test,y_pred)) print (classification_report(y test,y_pred)) print (accuracy_score(y test, y_pred)) ((19084 0 0 0 0 0 01 1859, 1887% 15685 15441 12149 14278) suppo 015685 0 0] [ 0 0 0 015441 0] e e 12149 ] 0 0 0 0 014278]] precision recall f1-score support 1.00 1.00 1.00 1.00 1.00 19084 1.0018591 1.00 18876 1.0015605 1.00 15441 1.00 12149 1.00 1.00 1.00 1.00 1.001.00 1.001.00 1.00 1.00 micro avg macro ave weighted avg 1.00 1.00 1.00 1.00 1.00 1.00 1.00 114024 1.00 114024 1.0 114024 1.0 In [44]: %matplotlib inline In I 1: upyter Untitled2 Last Checkpoint: 2 hours ago (autosaved) Edit View Insert Cell Kenel Widgets Help In [37]: from sklearn.metrics import classification report, confusion matrix, accuracy score print (confusion matrix(y test,y_pred)) print (classification_report(y test,y_pred)) print (accuracy_score(y test, y_pred)) ((19084 0 0 0 0 0 01 1859, 1887% 15685 15441 12149 14278) suppo 015685 0 0] [ 0 0 0 015441 0] e e 12149 ] 0 0 0 0 014278]] precision recall f1-score support 1.00 1.00 1.00 1.00 1.00 19084 1.0018591 1.00 18876 1.0015605 1.00 15441 1.00 12149 1.00 1.00 1.00 1.00 1.001.00 1.001.00 1.00 1.00 micro avg macro ave weighted avg 1.00 1.00 1.00 1.00 1.00 1.00 1.00 114024 1.00 114024 1.0 114024 1.0 In [44]: %matplotlib inline In I 1
Step by Step Solution
There are 3 Steps involved in it

Get step-by-step solutions from verified subject matter experts