

Question: How do I graph in Excel? I just need to put graphs in but I do not know what formulas or how to do this.
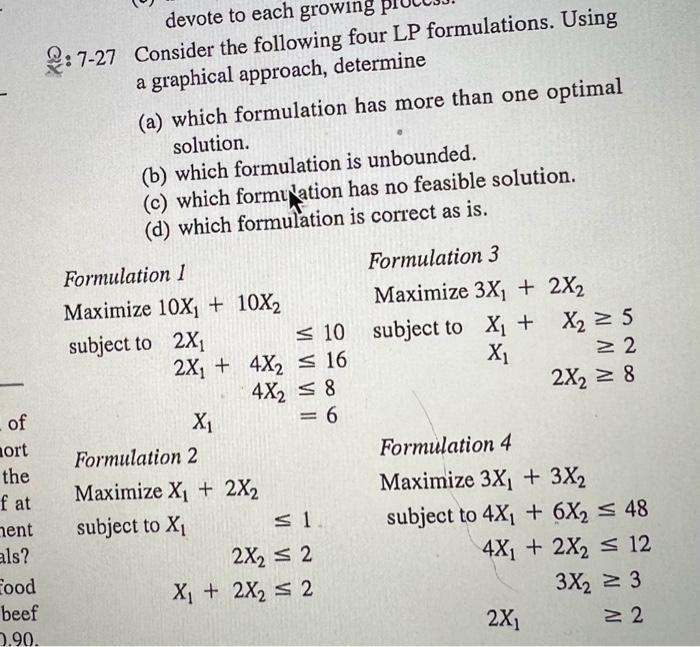
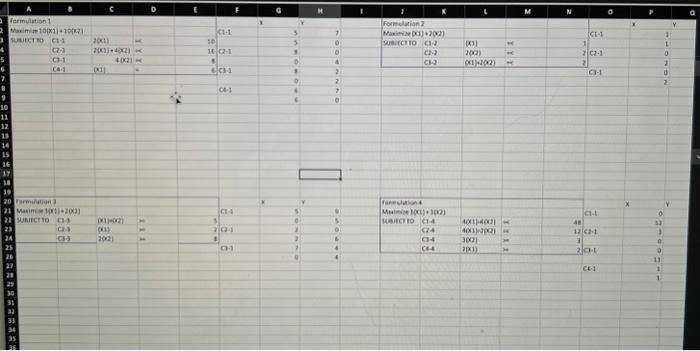
Q 7 : 27 Consider the following four LP formulations. Using a graphical approach, determine (a) which formulation has more than one optimal solution. (b) which formulation is unbounded. (c) which formy ation has no feasible solution. (d) which formulation is correct as is. Formulation 1 Maximize10X1+10X2subjectto2X12X1+4X24X2X110168=6 2X12X1+4X2X110168=6 Formulation 2 MaximizeX1+2X2 subject to X1 12X22 Formulation 3 Maximize3X1+2X2subjecttoX1+X25x122X28 Formulation 4 Maximize3X1+3X2subjectto4X1+6X2484X1+2X2123X23 Q 7 : 27 Consider the following four LP formulations. Using a graphical approach, determine (a) which formulation has more than one optimal solution. (b) which formulation is unbounded. (c) which formy ation has no feasible solution. (d) which formulation is correct as is. Formulation 1 Maximize10X1+10X2subjectto2X12X1+4X24X2X110168=6 2X12X1+4X2X110168=6 Formulation 2 MaximizeX1+2X2 subject to X1 12X22 Formulation 3 Maximize3X1+2X2subjecttoX1+X25x122X28 Formulation 4 Maximize3X1+3X2subjectto4X1+6X2484X1+2X2123X23
Step by Step Solution
There are 3 Steps involved in it

Get step-by-step solutions from verified subject matter experts