

Question: How do I graph this on my excel assignment? Im so lost. MAT212 Excel assignment. You own a company that manufactures computers for disabled individuals.
 How do I graph this on my excel assignment? Im so lost.
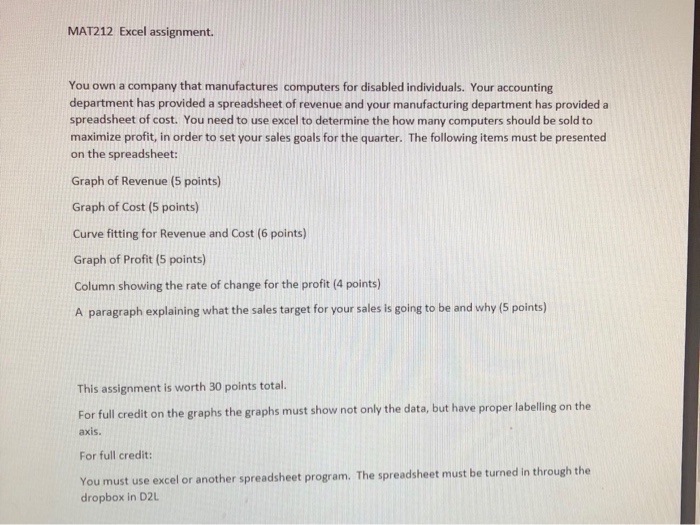
 MAT212 Excel assignment. You own a company that manufactures computers for disabled individuals. Your accounting department has provided a spreadsheet of revenue and your manufacturing department has provided a spreadsheet of cost. You need to use excel to determine the how many computers should be sold to maximize profit, in order to set your sales goals for the quarter. The following items must be presented on the spreadsheet: Graph of Revenue (5 points) Graph of Cost (5 points) Curve fitting for Revenue and Cost (6 points) Graph of Profit (5 points Column showing the rate of change for the profit (4 points) A paragraph explaining what the sales target for your sales is going to be and why (5 points) This assignment is worth 30 points total. For full credit on the graphs the graphs must show not only the data, but have proper labelling on the axis. For full credit: You mus t use excel or another spreadsheet program. The spreadsheet must be turned in through the dropbox in D2L
Step by Step Solution
There are 3 Steps involved in it

Get step-by-step solutions from verified subject matter experts