

Question: How do I interpret the Descriptive Statistics table? Descriptive Statistics Std. review Mean Deviation N quiz1 7.27 2.361 55 2 7.68 2.614 50 Total 7.47
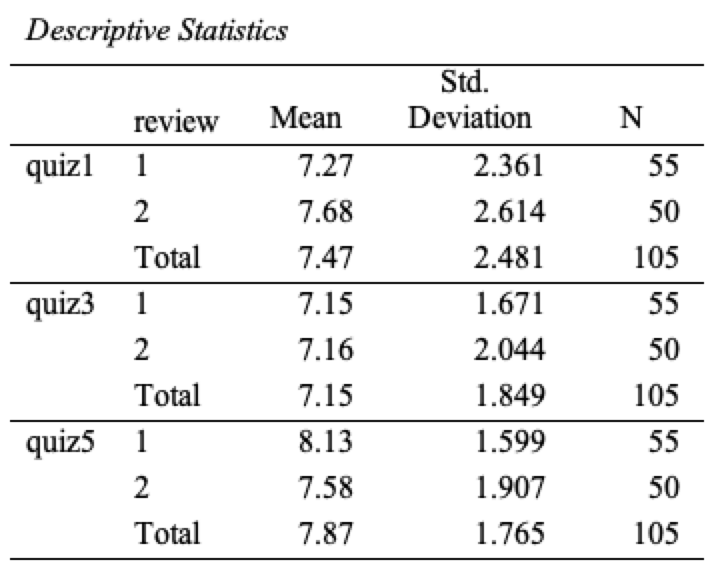
How do I interpret the Descriptive Statistics table?

Descriptive Statistics Std. review Mean Deviation N quiz1 7.27 2.361 55 2 7.68 2.614 50 Total 7.47 2.481 105 quiz3 7.15 1.671 55 2 7.16 2.044 50 Total 7.15 1.849 105 quiz5 8.13 1.599 55 2 7.58 1.907 50 Total 7.87 1.765 105
Step by Step Solution
There are 3 Steps involved in it
1 Expert Approved Answer
Step: 1 Unlock

Question Has Been Solved by an Expert!
Get step-by-step solutions from verified subject matter experts
Step: 2 Unlock
Step: 3 Unlock