

Question: How do I interpret this table? I think none of the follow the categories follow the 3sd rule. I am not sure 2. Bivariate Analysis
How do I interpret this table? I think none of the follow the categories follow the 3sd rule. I am not sure
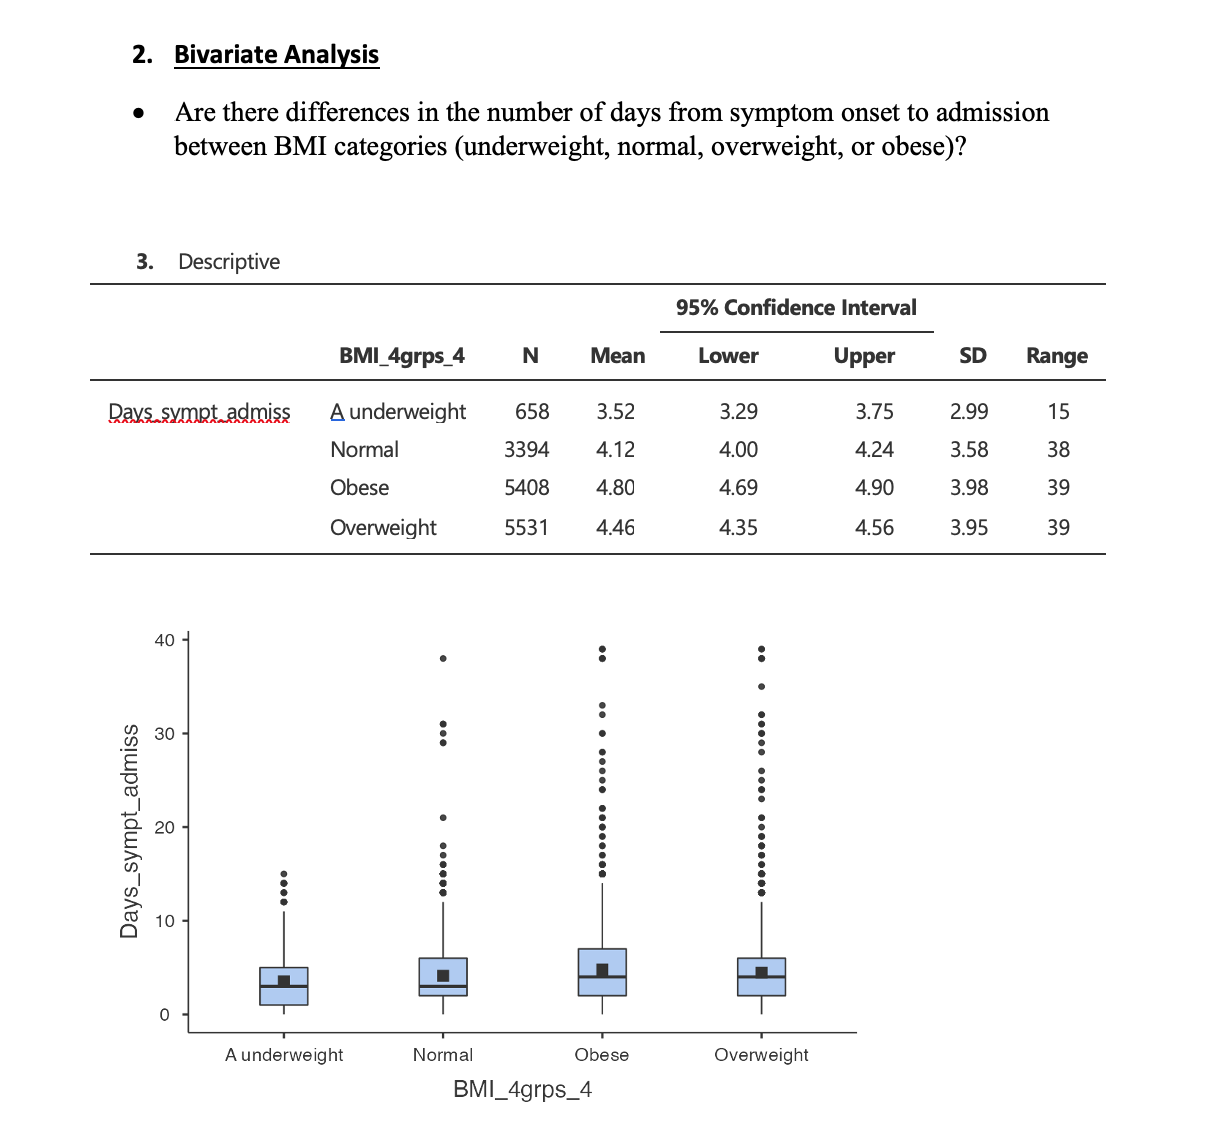
2. Bivariate Analysis . Are there differences in the number of days from symptom onset to admission between BMI categories (underweight, normal, overweight, or obese)? 3. Descriptive 95% Confidence Interval BMI_4grps_4 N Mean Lower Upper SD Range Days sympt admiss A underweight 658 3.52 3.29 3.75 2.99 15 Normal 3394 4.12 4.00 4.24 3.58 38 Obese 5408 4.80 4.69 4.90 3.98 39 Overweight 5531 4.46 4.35 4.56 3.95 39 40 - .. .. 30 - ... ........ ..... . .. ......... .... ..... Days_sympt-admiss 20 - - ...... . .... 10 - O A underweight Normal Obese Overweight BMI_4grps_4
Step by Step Solution
There are 3 Steps involved in it

Get step-by-step solutions from verified subject matter experts