

Question: how do i make a graph like the first one sith the information of the second one. Ive tried to do it but cant figure
how do i make a graph like the first one sith the information of the second one. Ive tried to do it but cant figure it out.
please do asap!! i just need the steps on making the graph 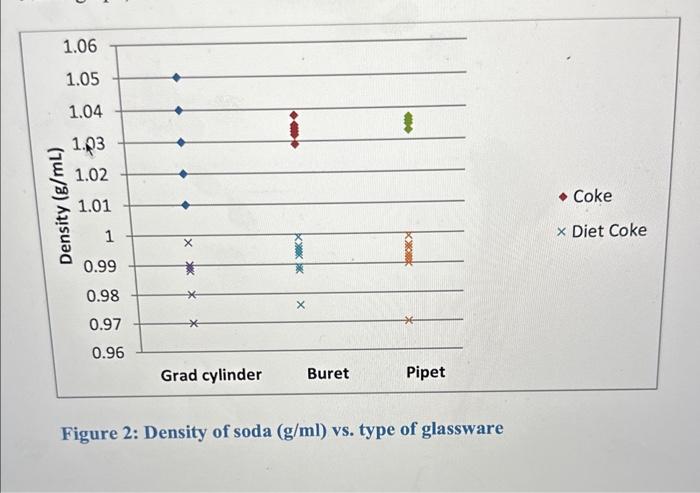
Figure 2: Density of soda (g/ml) vs. type of glassware Figure 2: Density of soda (g/ml) vs. type of glassware
Step by Step Solution
There are 3 Steps involved in it
1 Expert Approved Answer
Step: 1 Unlock

Question Has Been Solved by an Expert!
Get step-by-step solutions from verified subject matter experts
Step: 2 Unlock
Step: 3 Unlock