

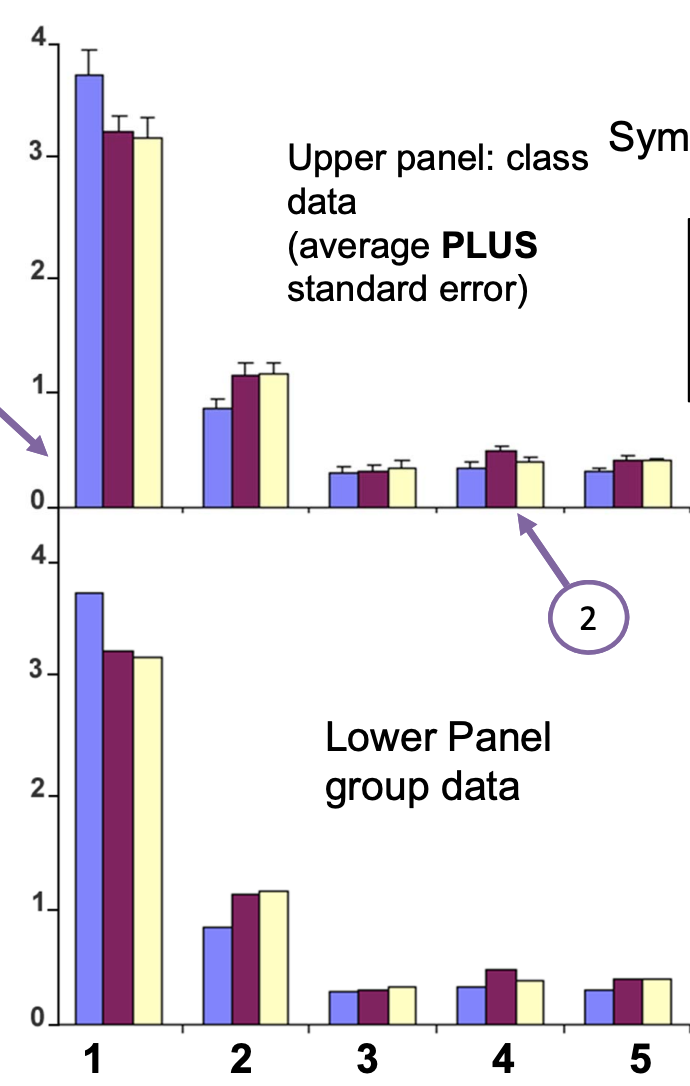
Question: how do I make a graph like this on excel? with the y axis split into 2 from 0-0 then from 0-90 for example? TT
how do I make a graph like this on excel? with the y axis split into 2 from 0-0 then from 0-90 for example?
Step by Step Solution
There are 3 Steps involved in it
1 Expert Approved Answer
Step: 1 Unlock

Question Has Been Solved by an Expert!
Get step-by-step solutions from verified subject matter experts
Step: 2 Unlock
Step: 3 Unlock