

Question: How do I plot a scatter plot in MATLAB, my time in 10 Minute intervals per reading of concentration. I have 65535 readings per concentration
How do I plot a scatter plot in MATLAB, my time in 10 Minute intervals per reading of concentration. I have 65535 readings per concentration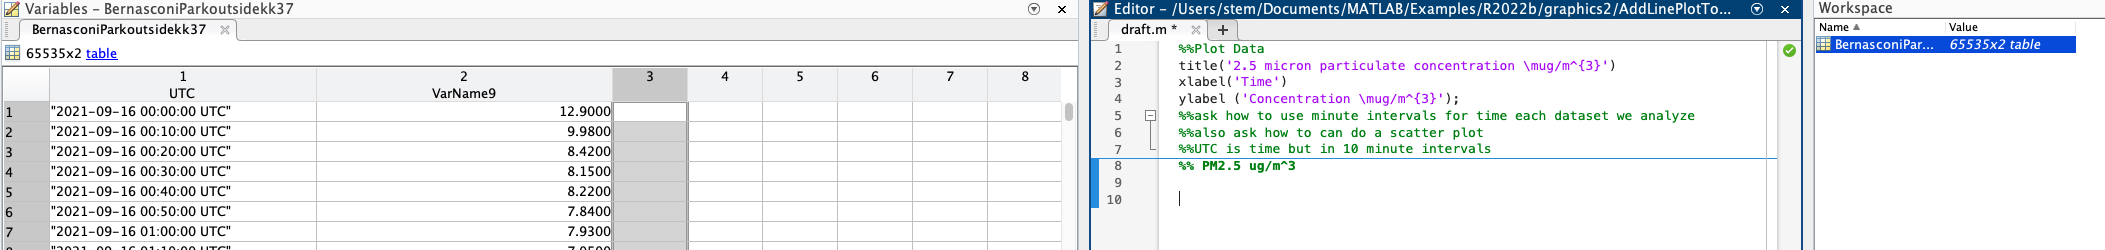
Step by Step Solution
There are 3 Steps involved in it
1 Expert Approved Answer
Step: 1 Unlock

Question Has Been Solved by an Expert!
Get step-by-step solutions from verified subject matter experts
Step: 2 Unlock
Step: 3 Unlock