

Question: How do I plot the frequency of YearBorn per Taxonomy group? Using ggplot in R . table [ [ , YearBorn,Taxon,count ] , [
How do I plot the frequency of YearBorn per Taxonomy group? Using ggplot in R
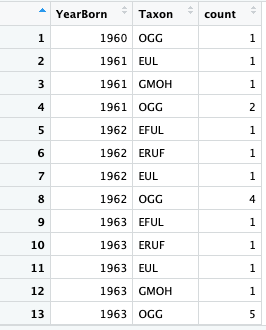
tableYearBorn,Taxon,countOGG,EUL,GMOH,OGG,EFUL,ERUF,EUL,OGG,EFUL,ERUF,EUL,GMOH,OGG,
Step by Step Solution
There are 3 Steps involved in it
1 Expert Approved Answer
Step: 1 Unlock

Question Has Been Solved by an Expert!
Get step-by-step solutions from verified subject matter experts
Step: 2 Unlock
Step: 3 Unlock