

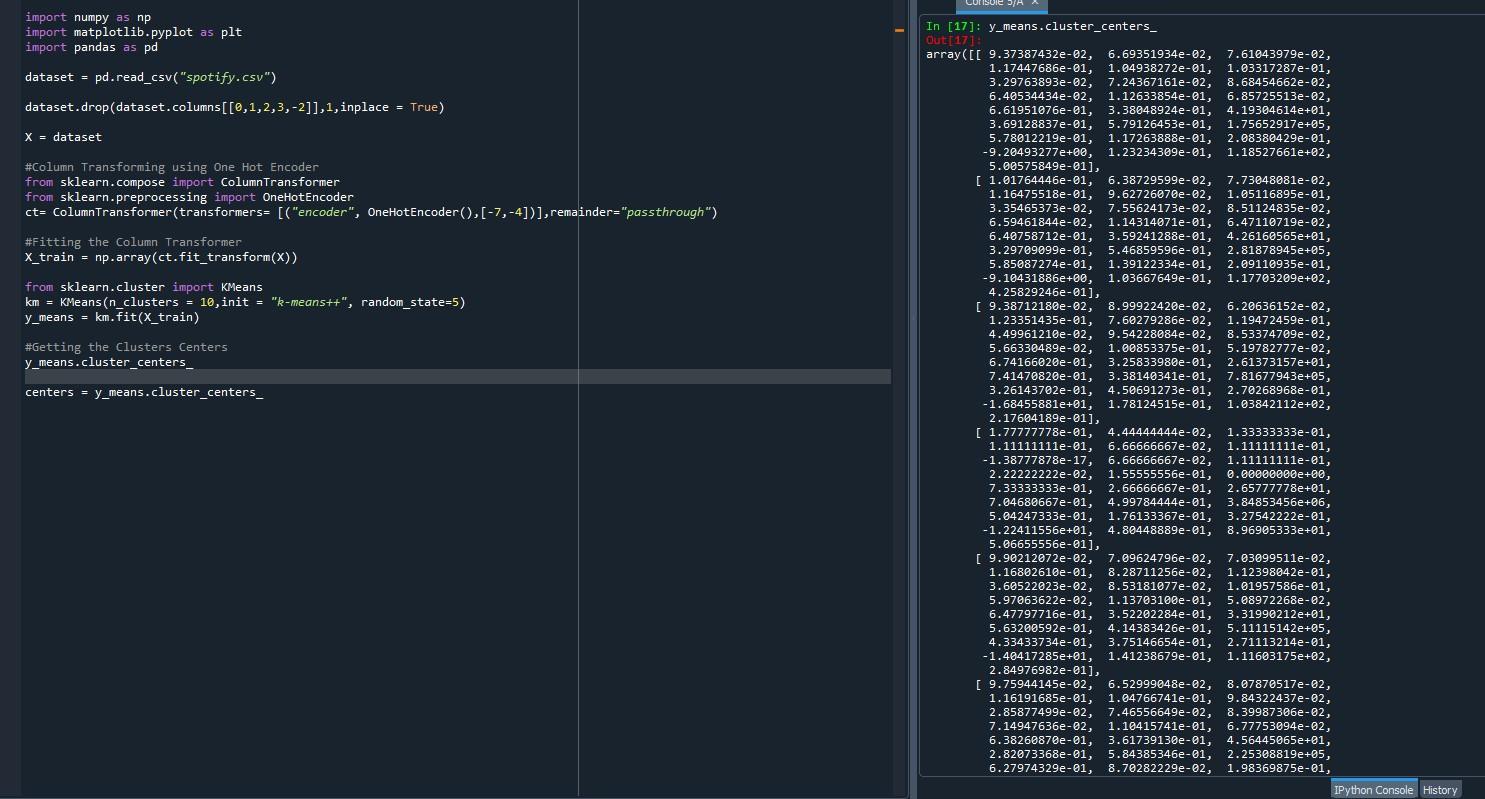
Question: How do I plot these cluster centers? Can I be given at least 3 methods on how do do it, this is K Means clustering
How do I plot these cluster centers? Can I be given at least 3 methods on how do do it, this is K Means clustering on a spotify dataset: https://www.kaggle.com/datasets/zaheenhamidani/ultimate-spotify-tracks-db?datasetId=135088&searchQuery=K+means
Step by Step Solution
There are 3 Steps involved in it
1 Expert Approved Answer
Step: 1 Unlock

Question Has Been Solved by an Expert!
Get step-by-step solutions from verified subject matter experts
Step: 2 Unlock
Step: 3 Unlock