

Question: How do I produce a graph for a long straddle strategy and a strip strategy with the following data on Excel, Company Name APPLE INC
How do I produce a graph for a long straddle strategy and a strip strategy with the following data on Excel,
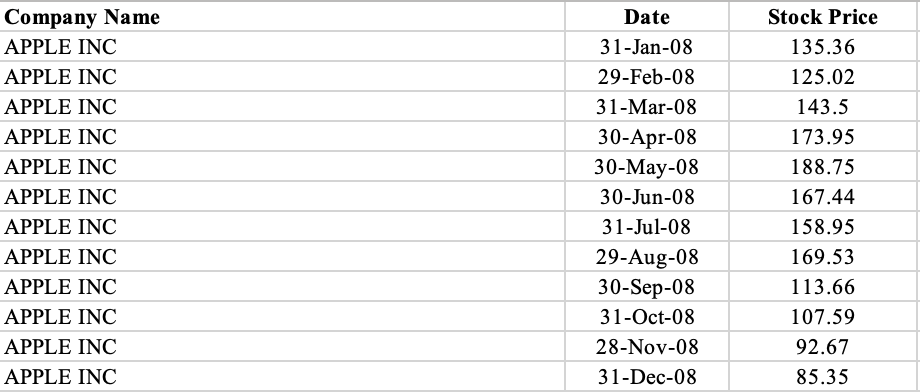

Company Name APPLE INC APPLE INC APPLE INC APPLE INC APPLE INC APPLE INC APPLE INC APPLE INC APPLE INC APPLE INC APPLE INC APPLE INC Date 31-Jan-08 29-Feb-08 31-Mar-08 30-Apr-08 30-May-08 30-Jun-08 31-Jul-08 29-Aug-08 30-Sep-08 31-Oct-08 28-Nov-08 31-Dec-08 Stock Price 135.36 125.02 143.5 173.95 188.75 167.44 158.95 169.53 113.66 107.59 92.67 85.35 Company name APPLE INC Ticker AAPL Date 2-Jan-08 Stike Price 200 Bid Price - Call 39.3 Ask Price - Call 39.65 Bid Price - Put 36.95 Ask Price Put 37.3 Stock Price 194.84
Step by Step Solution
There are 3 Steps involved in it

Get step-by-step solutions from verified subject matter experts