

Question: How do i properly answer this question using the data below: Prepare correlations of price and square footage of homes, overall and by categories of
How do i properly answer this question using the data below: Prepare correlations of price and square footage of homes, overall and by categories of bedrooms, bathrooms, and grade. Test for significances of the relationships and interpret your results?
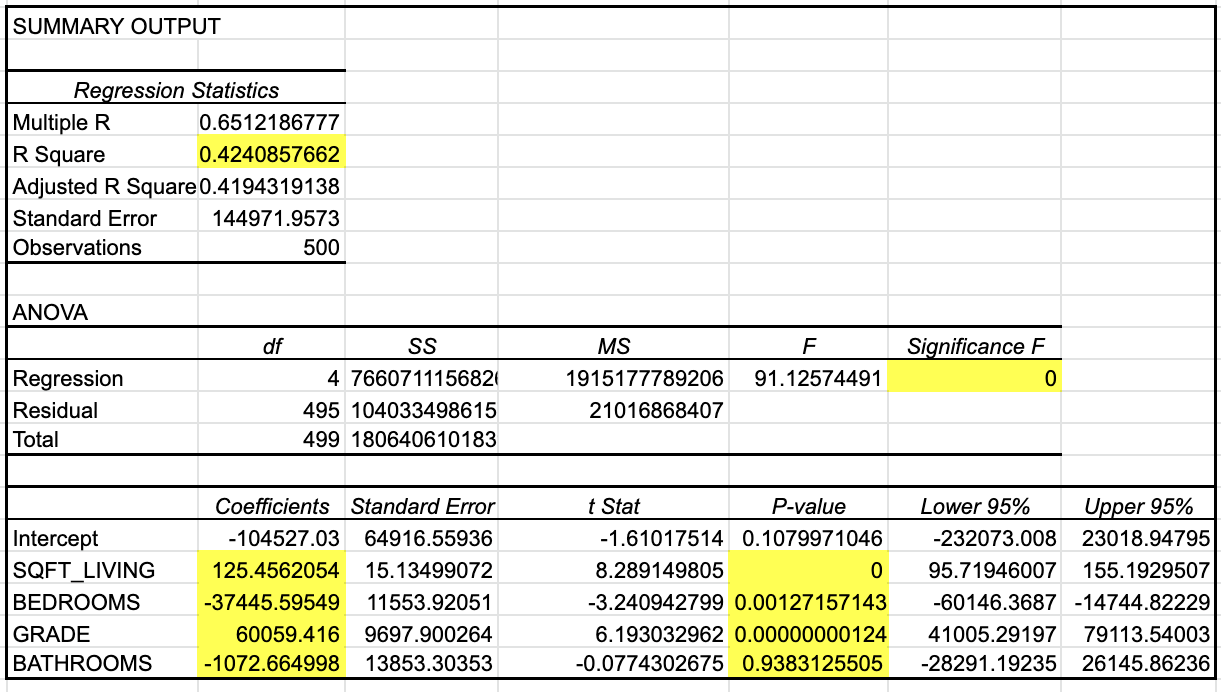
SUMMARY OUTPUT Regression Statistics Multiple R 0.6512186777 R Square 0.4240857662 Adjusted R Square 0.4194319138 Standard Error 144971.9573 Observations 500 ANOVA df SS MS F Significance F Regression 4 7660711156821 1915177789206 91. 12574491 0 Residual 495 104033498615 21016868407 Total 499 180640610183 Coefficients Standard Error t Stat P-value Lower 95% Upper 95% Intercept -104527.03 64916.55936 -1.61017514 0.1079971046 -232073.008 23018.94795 SQFT LIVING 125.4562054 15.13499072 8.289149805 0 95.71946007 155. 1929507 BEDROOMS -37445.59549 11553.92051 -3.240942799 0.00127157143 -60146.3687 -14744.82229 GRADE 60059.416 9697.900264 6. 193032962 0.00000000124 41005.29197 79113.54003 BATHROOMS -1072.664998 13853.30353 -0.0774302675 0.9383125505 -28291.19235 26145.86236
Step by Step Solution
There are 3 Steps involved in it

Get step-by-step solutions from verified subject matter experts