

Question: How do I read/interpret the histogram? For the age, weight and CPK- what can I focus on when it comes to distribution while writing my


How do I read/interpret the histogram?
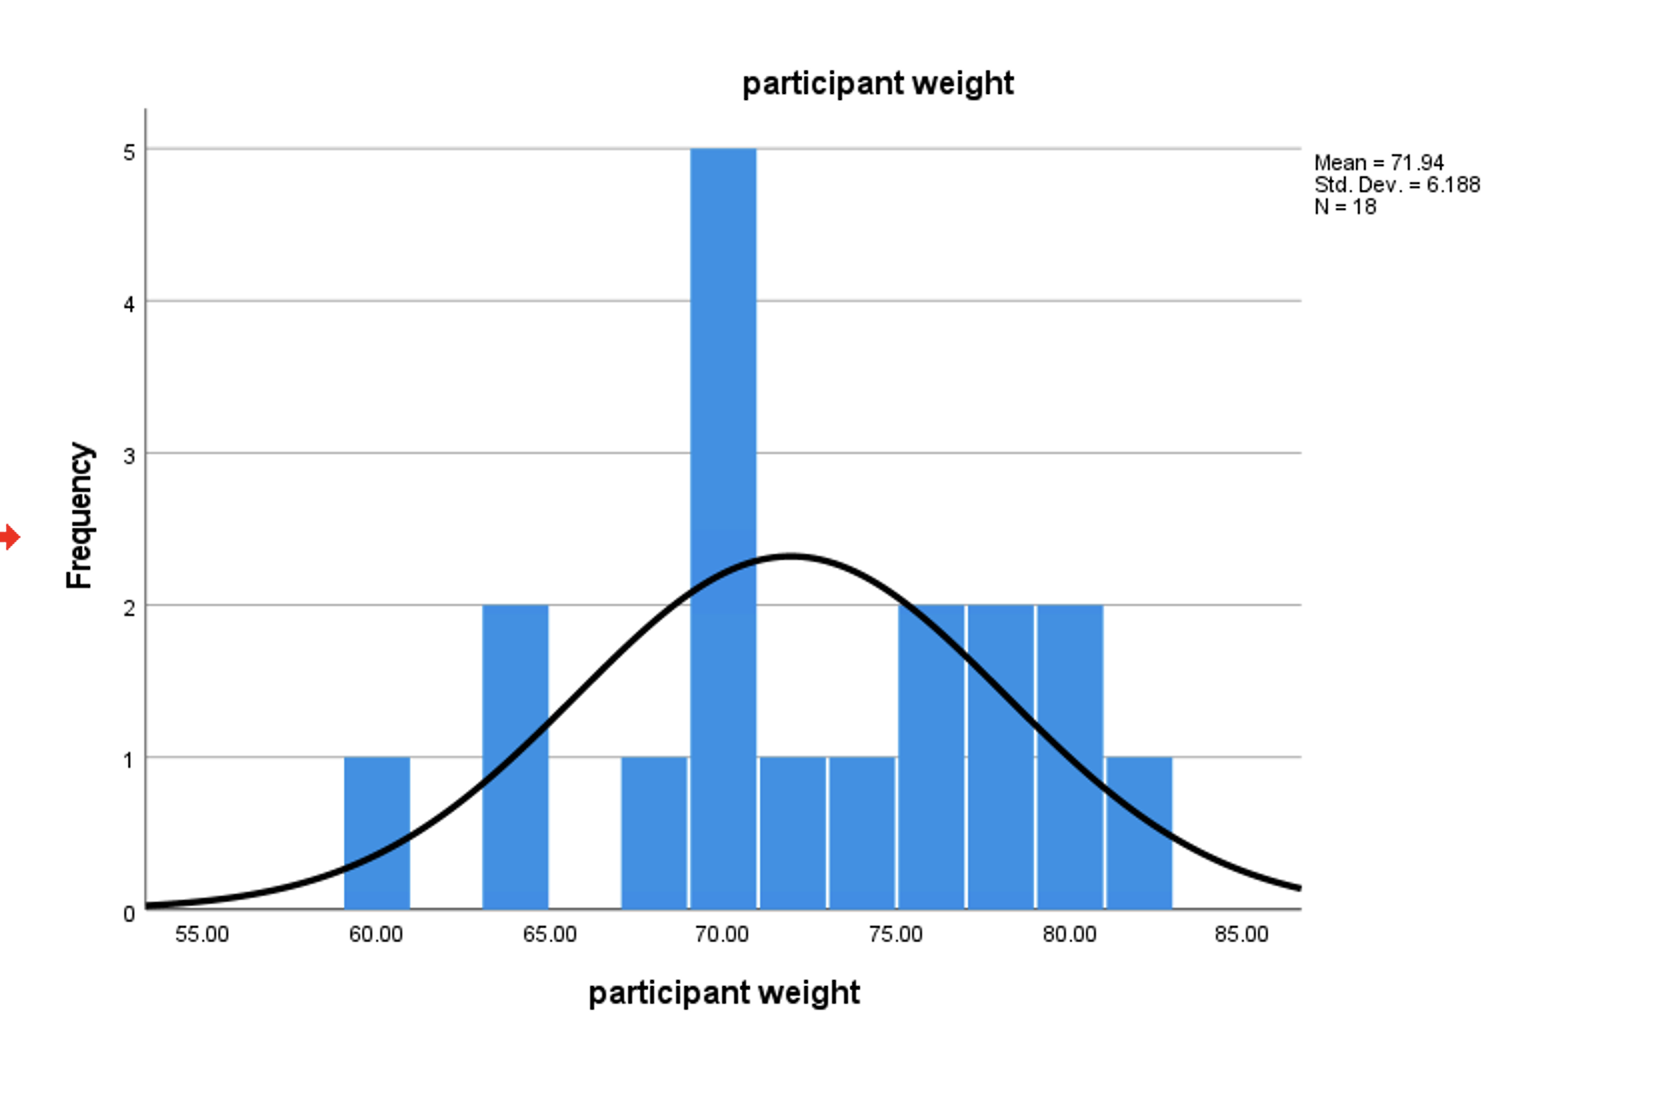
For the age, weight and CPK- what can I focus on when it comes to distribution while writing my discussion?
What are some tips in adding "details that are interesting" when writing my discussion?
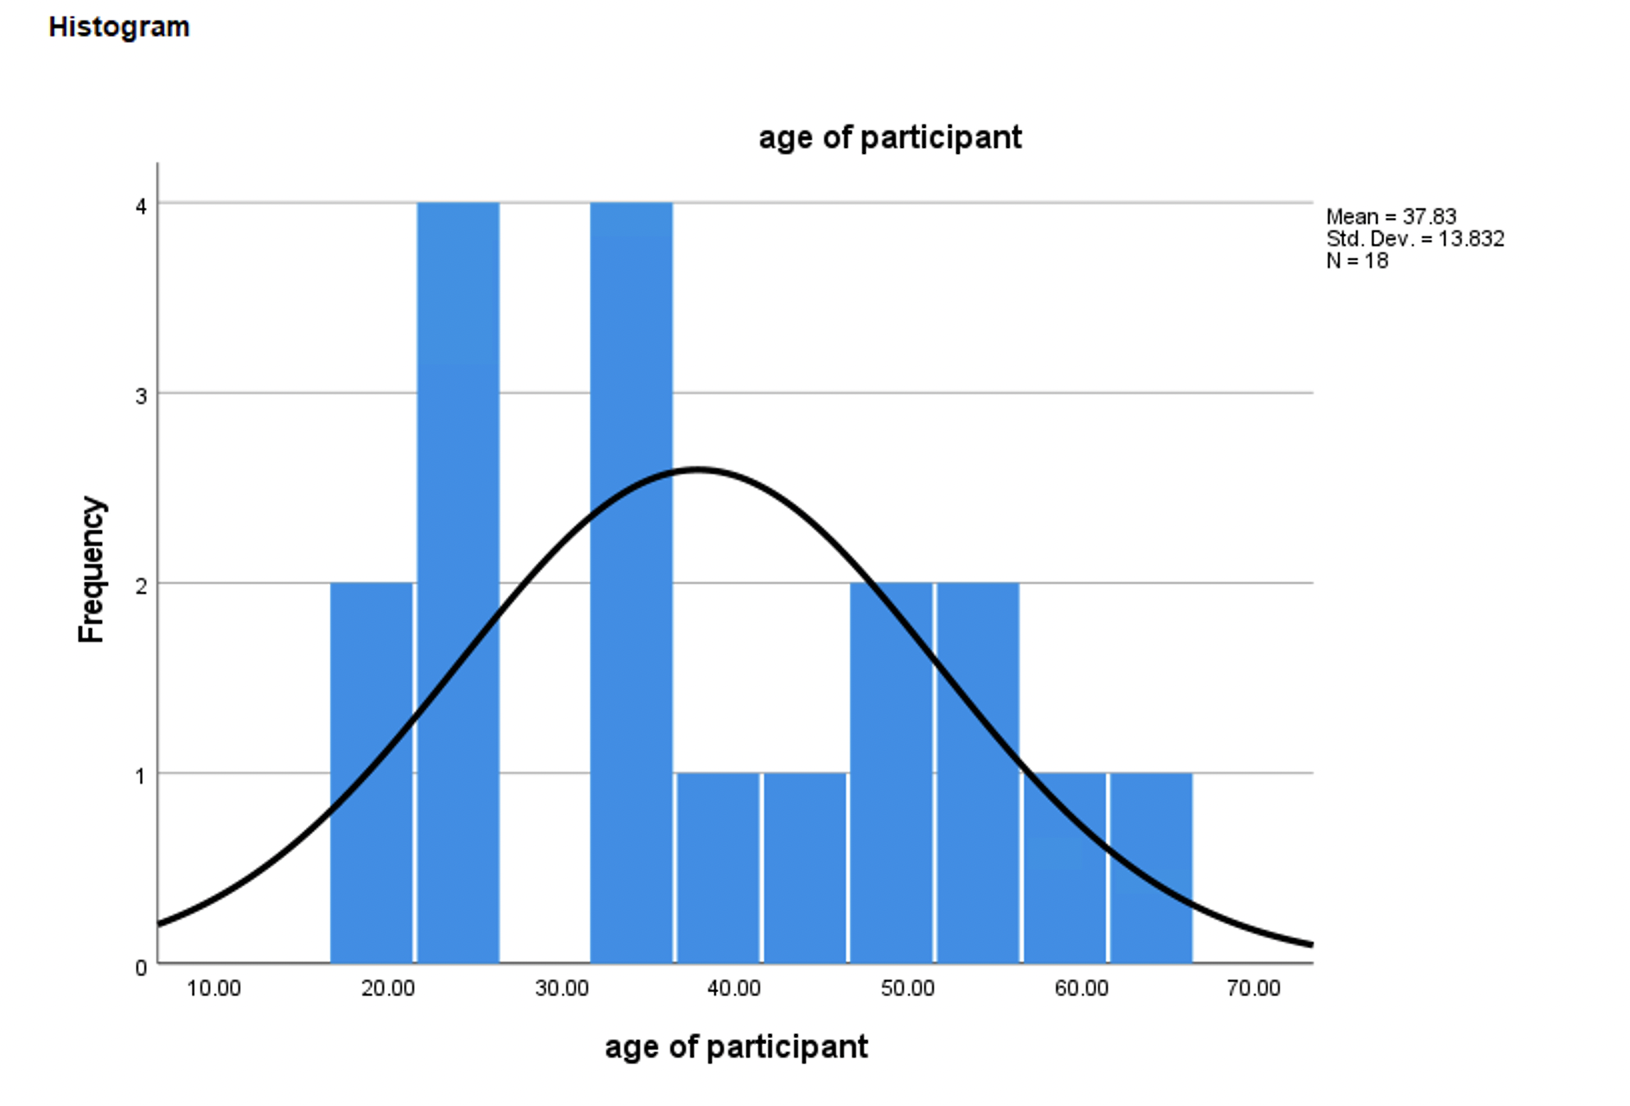
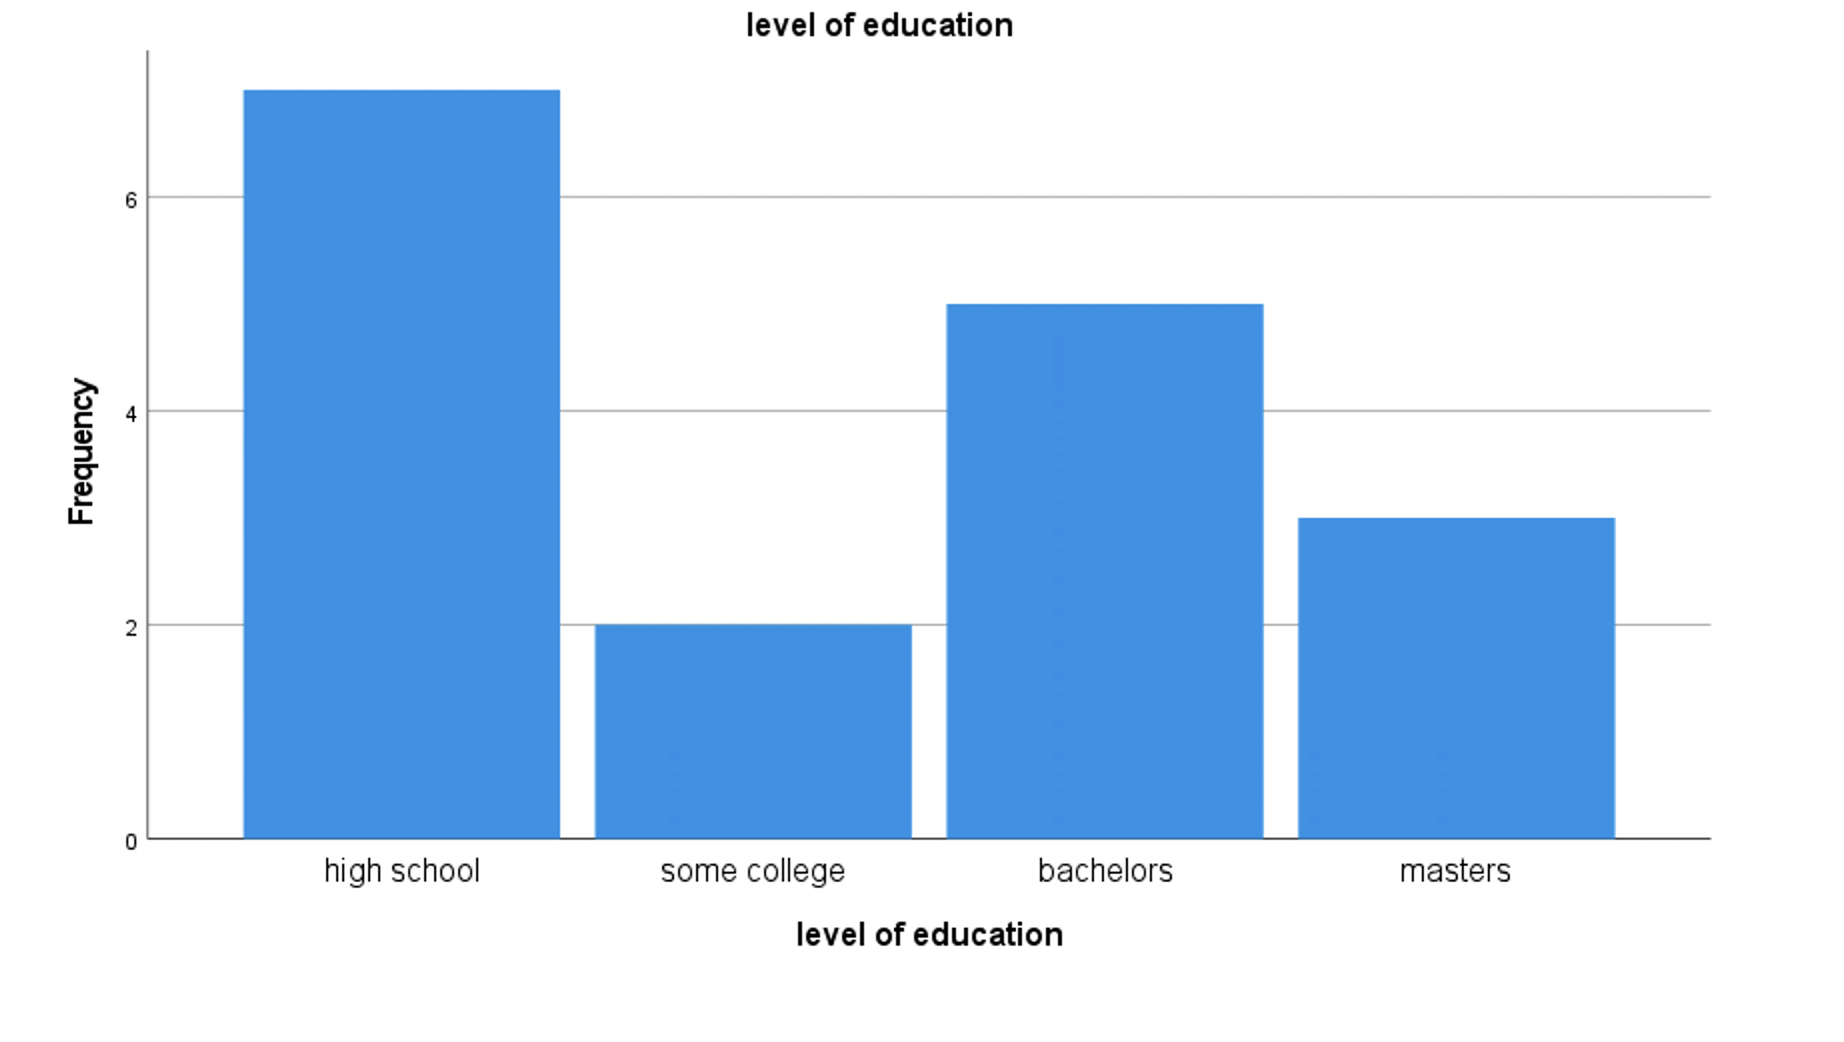

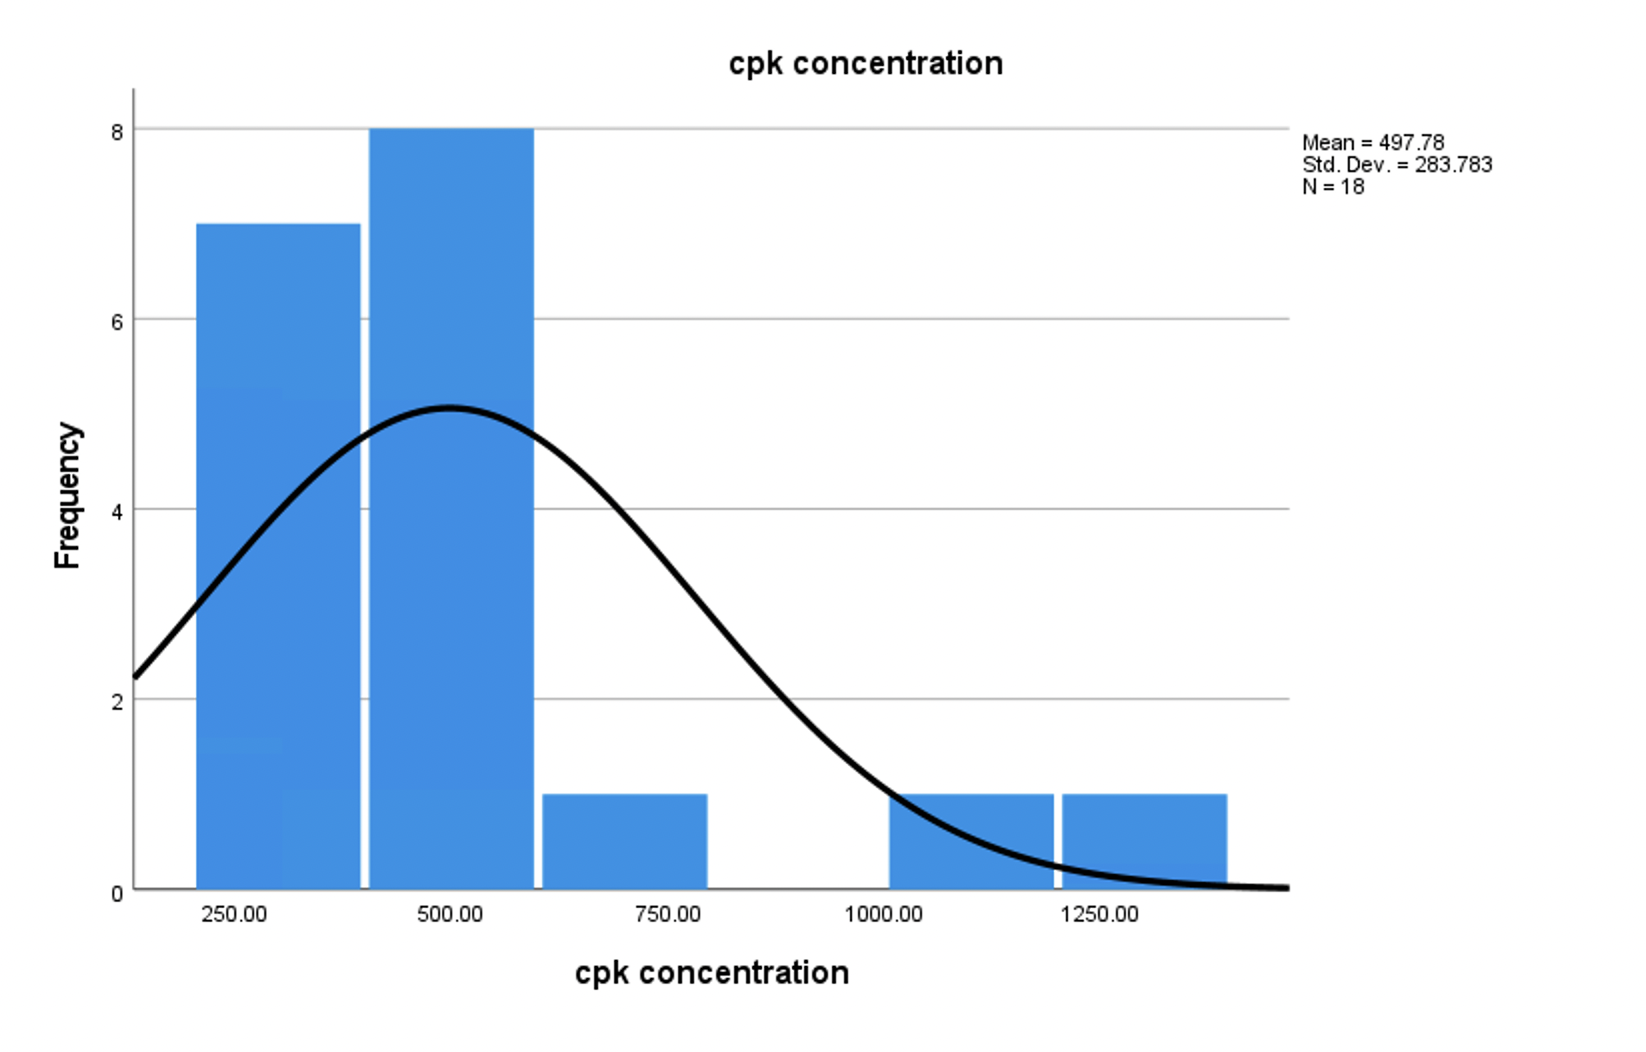
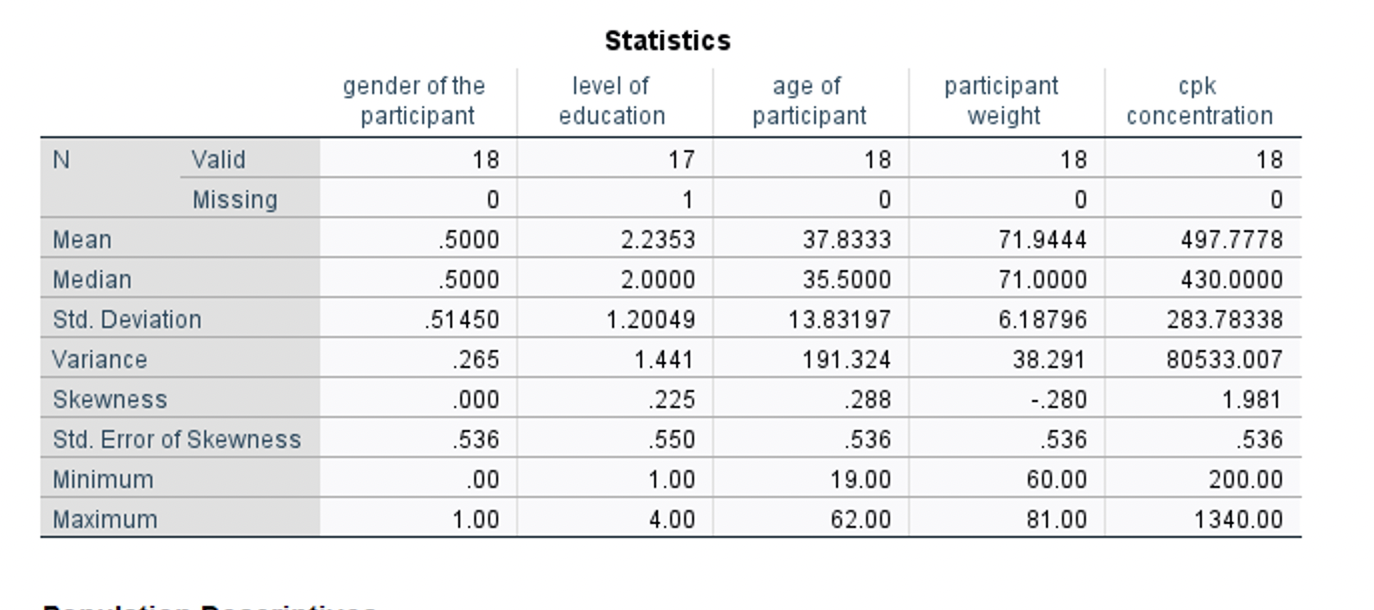

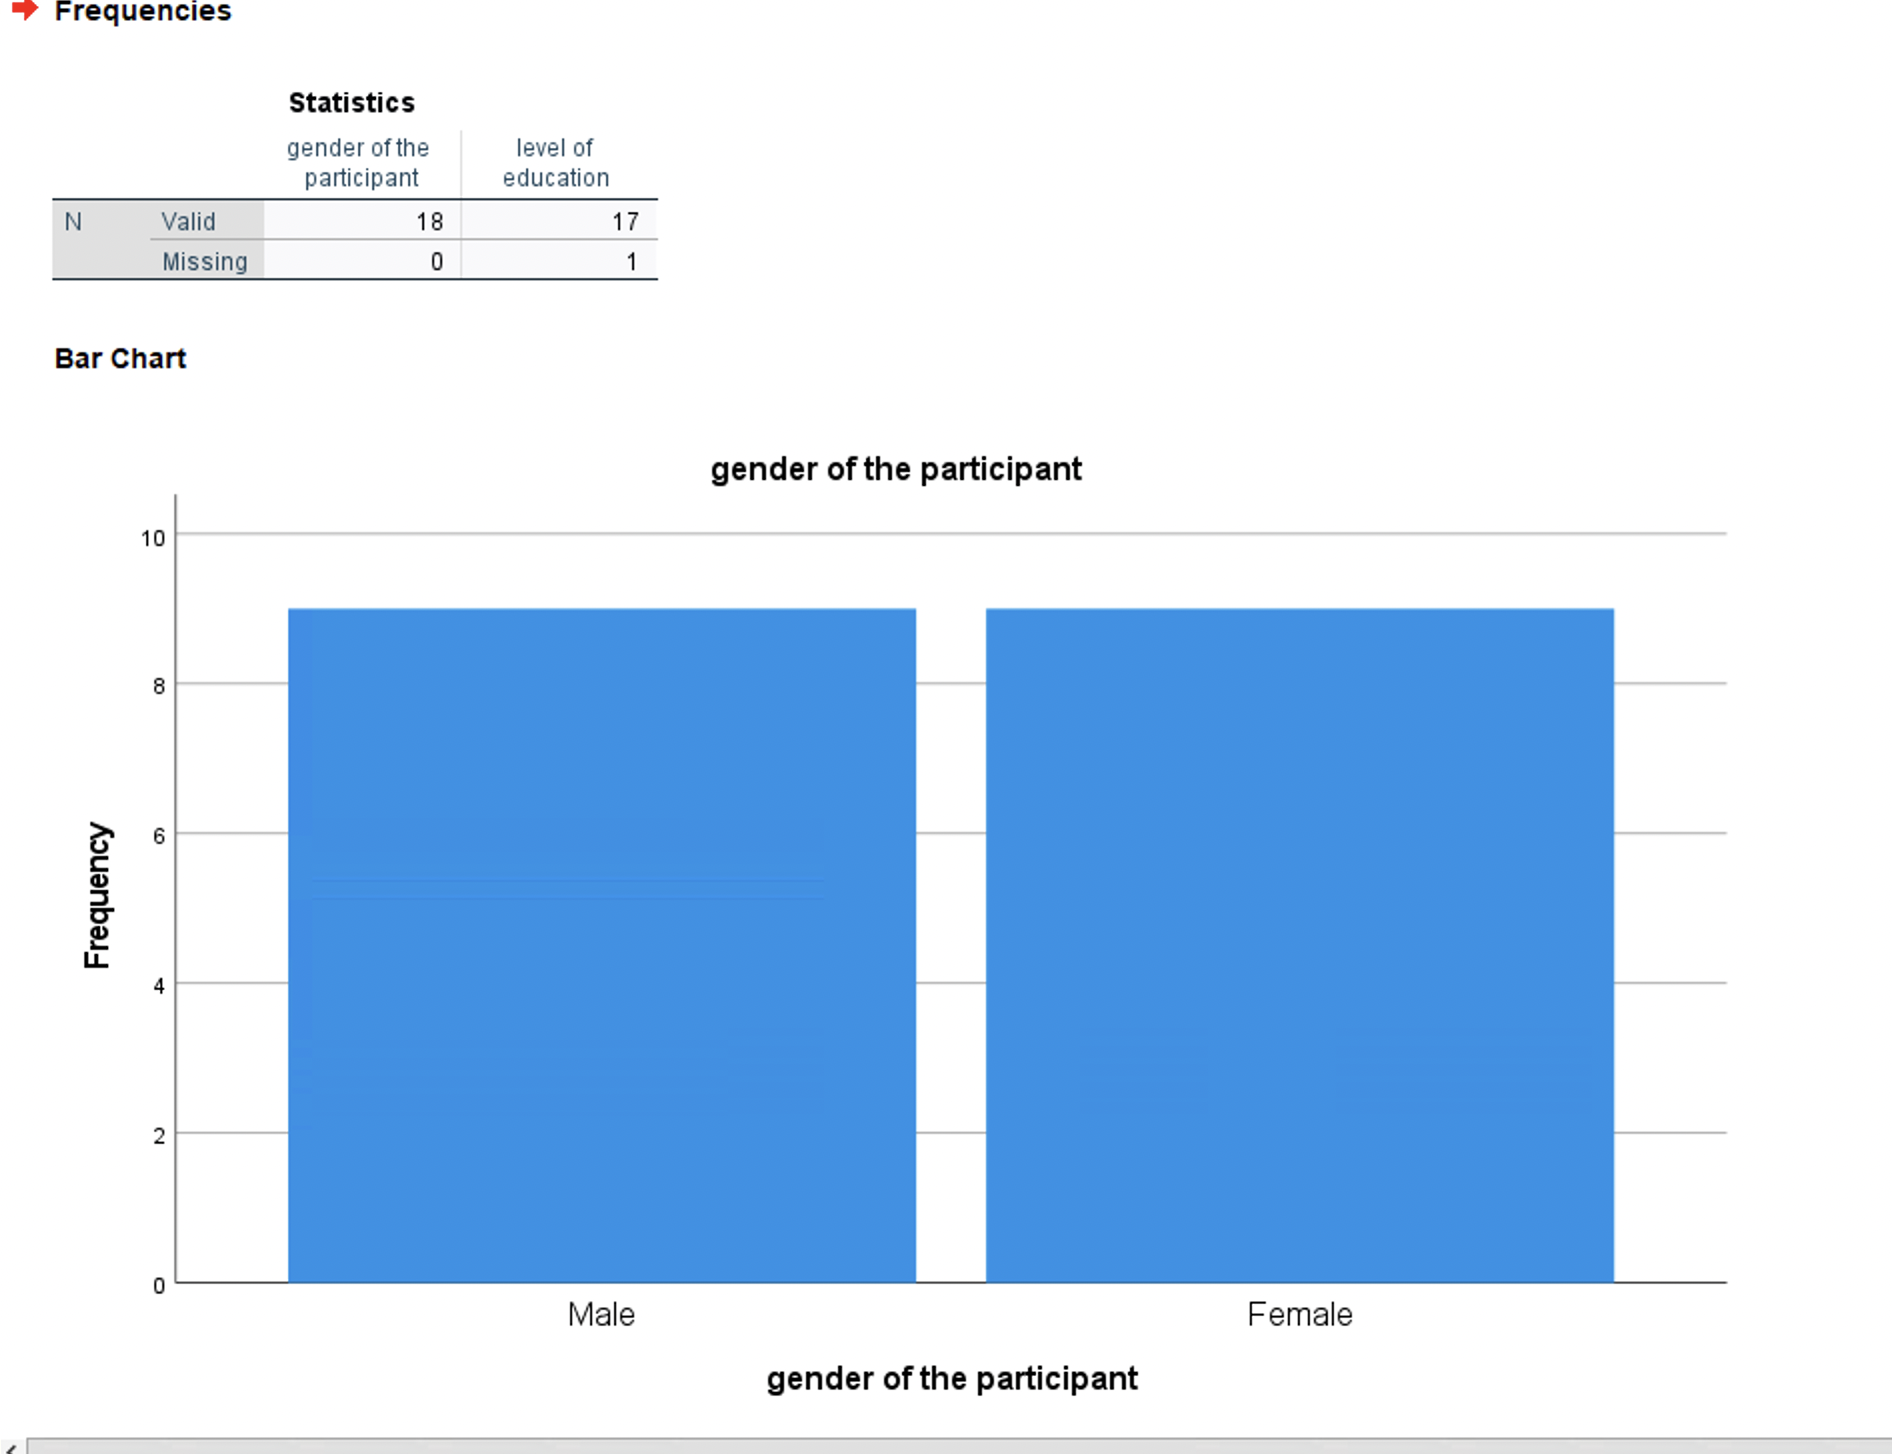
Histogram age of participant Mean = 37.83 Std. Dev. = 13.832 N = 18 3 Frequency 2 0 10.00 20.00 30.00 40.00 50.00 60.00 70.00 age of participantFrequency high school level of education some college bachelors level of education masters Frequencies Statistics gender of the level of participant education N Valid 18 17 Missing 0 Bar Chart gender of the participant 10 8 6 Frequency 4 2 Male Female gender of the participantcpk concentration 8 Mean = 497.78 Std. Dev. = 283.783 N = 18 6 Frequency 4 2 0 250.00 500.00 750.00 1000.00 1250.00 cpk concentrationStatistics gender of the level of age of participant cpk participant education participant weight concentration N Valid 18 17 18 18 18 Missing 0 0 0 0 Mean 5000 2.2353 37.8333 71.9444 497.7778 Median 5000 2.0000 35.5000 71.0000 430.0000 Std. Deviation .51450 1.20049 13.83197 6.18796 283.78338 Variance .265 1.441 191.324 38.291 80533.007 Skewness 000 .225 288 -.280 1.981 Std. Error of Skewness .536 .550 536 536 .536 Minimum 00 1.00 19.00 60.00 200.00 Maximum 1.00 4.00 62.00 81.00 1340.00
Step by Step Solution
There are 3 Steps involved in it

Get step-by-step solutions from verified subject matter experts